Python- How to make colorbar orientation horizontal?
Solution 1
You need to use location="bottom"
cbar=m.colorbar(trend, size='3%',ticks=bounds,extend="max",location="bottom")
I got that from this example in the basemap documentation.
Solution 2
As others have already stated in the comments
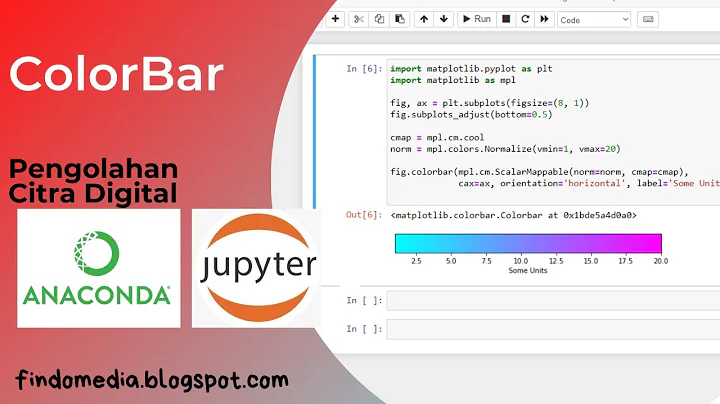
plt.colorbar(orientation='horizontal')
is an alternative (simpler) solution!
Related videos on Youtube
ChristineB
Updated on July 09, 2022Comments
-
ChristineB almost 2 years
So I have a plot with a basemap, a colormesh on top, and a colorbar set to cbar. I want the colorbar orientation to be horizontal instead of vertical, but when I set orientation='horizontal' in the cbar=m.colorbar line after extend='max', I get the following error: "colorbar() got multiple values for keyword argument 'orientation'"
Someone on another question explained why this happens, but I honestly couldn't understand the answer or see an explanation of how to fix it. Can someone help? I tried using plt.colorbar instead, but for some reason that doesn't accept my tick settings.
Here's what my plot looked like before...
#Set cmap properties
bounds = np.array([0.1,0.2,0.5,1,2,3,4,6,9,13,20,30])
norm = colors.LogNorm(vmin=0.1,vmax=30) #creates logarithmic scale

#Create basemap
fig = plt.figure(figsize=(15.,10.))
m = Basemap(projection='cyl',llcrnrlat=-90,urcrnrlat=90,llcrnrlon=0,urcrnrlon=360.,lon_0=180.,resolution='c')
m.drawcoastlines(linewidth=1)
m.drawcountries(linewidth=1)
m.drawparallels(np.arange(-90,90,30.),linewidth=0.3)
m.drawmeridians(np.arange(-180.,180.,90.),linewidth=0.3)
meshlon,meshlat = np.meshgrid(lon,lat)
x,y = m(meshlon,meshlat)

#Plot variables
trend = m.pcolormesh(x,y,lintrends_36,cmap='jet', norm=norm, shading='gouraud')

#Set plot properties
plt.tight_layout()
#Colorbar
cbar=m.colorbar(trend, size='3%',ticks=bounds,extend="max") #THIS LINE
cbar.set_label(label='Linear Trend (mm/day/decade)',size=30)
cbar.set_ticklabels(bounds)
#Titles & labels
plt.suptitle('Linear Trends of Precipitation (CanESM2)',fontsize=40,y=0.962)
plt.title('a) 1979-2014',fontsize=40)
plt.ylabel('Latitude',fontsize=30)
plt.show()
When orientation is attempted (all other code being the same)...

And the map looks like this.
-
Laurent S almost 8 yearsCan you post the traceback for the error, and maybe a link to the post you mention?
-
Paul H almost 8 yearswhat if you use
fig.colorbarinstead ofm.colorbar? -
ChristineB almost 8 yearsAdded traceback, and when I tried plt.colorbar, I realized a number of the parameters I had set with cbar didn't work. For instance, ticks=bounds inside the cbar=m.colorbar() line didn't work for whatever reason. Here's the post I mentioned- stackoverflow.com/questions/18950054/…
-
ChristineB almost 8 yearsClarification- when I use fig.colorbar() or plt.colorbar() instead of cbar=m.colorbar() and I remove the size argument (it wasn't allowed), I get the horizontal colorbar, but my ticks argument is ignored. I really need to keep the custom tick labels.
-
Laurent S almost 8 yearsTwo things: I don't think that answer you link to is the problem, the declaration for
colorbarlooks ok in the traceback. Also, the code you posted is not the one shown in the traceback, whereorientation='horizontal'appears while it's not in your posted code :) -
ChristineB almost 8 yearsYeah, the code I posted above the plot shows what the plot looks like before trying to change the colorbar orientation. The only difference between my posted code and the traceback one is in the traceback version, I have orientation='horizontal' set inside the cbar=m.colorbar() method. Otherwise,the code is the same.
-
ChristineB almost 8 yearsAdd of course, I get that traceback error when I attempt to change the orientation. It doesn't appear when I leave the orientation argument out. I edited the post to show what the plot looks like with the traceback code.
-
-
ChristineB almost 8 yearsThank you! I also used the "pad" argument to position it below my x-axis label.
-
AruniRC over 6 yearsor equivalently
plt.colorbar(orientation='horizontal')


