python pandas DataFrame subplot in columns and rows
11,943
Solution 1
In current versions of Pandas, DataFrame.plot features the layout keyword for this purpose.
df.plot(subplots=True, layout=(2,2), ...)
Solution 2
cplcloud's answer works, but following code will give you a bit more structure so that you can start configuring more if you do not need the loop.
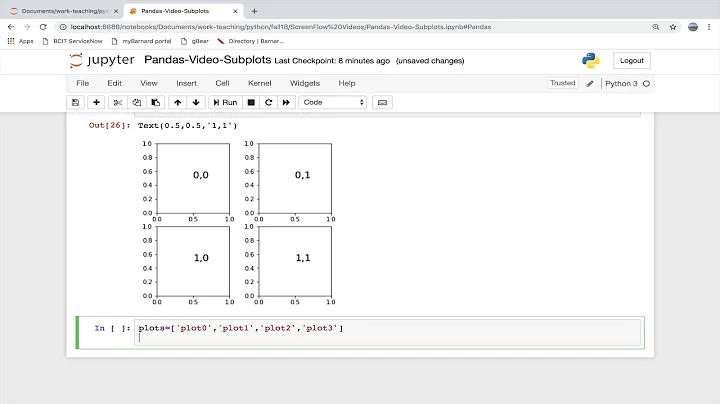
fig, axes = plt.subplots(nrows=2, ncols=2)
fig.set_figheight(6)
fig.set_figwidth(8)
df[0].plot(ax=axes[0,0], style='r', label='Series'); axes[0,0].set_title(0)
df[1].plot(ax=axes[0,1]); axes[0,1].set_title(1)
df[2].plot(ax=axes[1,0]); axes[1,0].set_title(2)
df[3].plot(ax=axes[1,1]); axes[1,1].set_title(3)
fig.tight_layout()
Added some example on axis 0 to show how you can further configure it.
Related videos on Youtube
 03 : 29
010b Subplots from pandas DataFrames
 33 : 35
Python Pandas Tutorial (Part 2): DataFrame and Series Basics - Selecting Rows and Columns
 21 : 47
How do I select multiple rows and columns from a pandas DataFrame?
 21 : 22
Matplotlib Tutorial (Part 10): Subplots
 12 : 30
How to plot multiple sub-plots using Matplotlib and Seaborn | Session With Sumit
 10 : 45
Python Pandas and Subplots
 16 : 20
Subplots in Matplotlib | Matplotlib Tutorial Part 7 | Creating and Customising Subplots in Python
 01 : 12
Pandas : python pandas DataFrame subplot in columns and rows
Author by
tesla1060
Updated on September 15, 2022Comments
-
tesla1060 over 1 year
I would like to produce a subplot from data 4 column DataFrame into 2 rows and 2 columns
df =pd.DataFrame(np.random.randn(6,4),index=pd.date_range('1/1/2000',periods=6, freq='1h'))However below will give a 4 row and 1 column plot
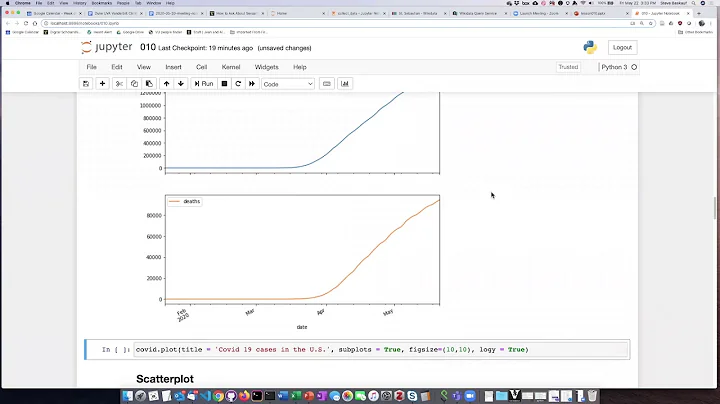
df.plot(use_index=False, title=f, subplots=True, sharey=True, figsize=(8, 6))Thanks.
-
Thorsten Kranz about 11 yearsYou should do it by hand,
import matplotlib.pyplot as plt, then something likefor i in df: plt.subplot(2,2,i+1);plt.plot(df[i]); -
Phillip Cloud almost 11 years@tesla1060 i suppose pandas could allow some sort of
figshapeargument...
-
-
mbarete over 4 yearsThis is the quickest implementation of OP's request