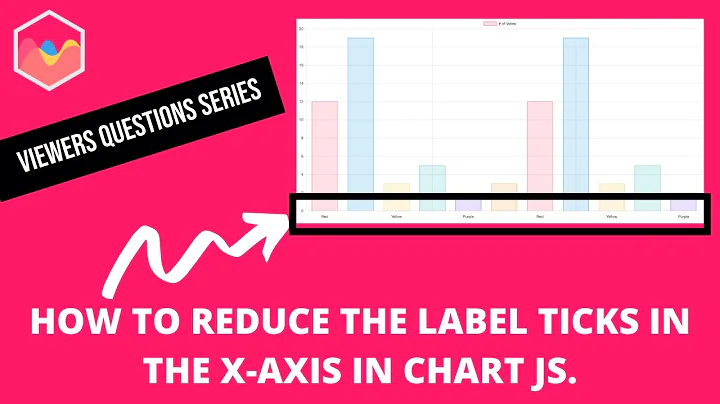
Remove x-axis label/text in chart.js
Solution 1
UPDATE chart.js 2.1 and above
var chart = new Chart(ctx, {
    ...
    options:{
        scales:{
            xAxes: [{
                display: false //this will remove all the x-axis grid lines
            }]
        }
    }
});
var chart = new Chart(ctx, {
    ...
    options: {
        scales: {
            xAxes: [{
                ticks: {
                    display: false //this will remove only the label
                }
            }]
        }
    }
});
Reference: chart.js documentation
Old answer (written when the current version was 1.0 beta) just for reference below:
To avoid displaying labels in chart.js you have to set scaleShowLabels : false and also avoid to pass the labels:
<script>
    var options = {
        ...
        scaleShowLabels : false
    };
    var lineChartData = {
        //COMMENT THIS LINE TO AVOID DISPLAYING THE LABELS
        //labels : ["1","2","3","4","5","6","7"],
        ...
    }
    ...
</script>
Solution 2
This is for chart.js ^3.0.0
Remove x-axis labels and grid chart lines
var chart = new Chart(ctx, {
    ...
    options:{
        scales:{
            x: {
                display: false
            }
        }
    }
});
Remove only x-axis labels
var chart = new Chart(ctx, {
    ...
    options: {
        scales: {
            x: {
               ticks: {
                   display: false
              }
           }
        }
    }
});
Solution 3
(this question is a duplicate of In chart.js, Is it possible to hide x-axis label/text of bar chart if accessing from mobile?) They added the option, 2.1.4 (and maybe a little earlier) has it
var myLineChart = new Chart(ctx, {
    type: 'line',
    data: data,
    options: {
        scales: {
            xAxes: [{
                ticks: {
                    display: false
                }
            }]
        }
    }
}
Solution 4
var lineChartData = {
    labels: ["", "", "", "", "", "", ""] // To hide horizontal labels
	,datasets : [
		{
			label: "My First dataset",
			fillColor : "rgba(220,220,220,0.2)",
			strokeColor : "rgba(220,220,220,1)",
			pointColor : "rgba(220,220,220,1)",
			pointStrokeColor : "#fff",
			pointHighlightFill : "#fff",
			pointHighlightStroke : "rgba(220,220,220,1)",
			data: [28, 48, 40, 19, 86, 27, 90]
		}
	]
}
window.onload = function(){
	var options = {
		scaleShowLabels : false // to hide vertical lables
	};
	var ctx = document.getElementById("canvas1").getContext("2d");
	window.myLine = new Chart(ctx).Line(lineChartData, options);
}
Solution 5
Faced this issue of removing the labels in Chartjs now. Looks like the documentation is improved. http://www.chartjs.org/docs/#getting-started-global-chart-configuration
Chart.defaults.global.legend.display = false;
this global settings prevents legends from being shown in all Charts. Since this was enough for me, I used it. I am not sure to how to avoid legends for individual charts.
Related videos on Youtube
 03 : 26
 01 : 40
 13 : 41
 14 : 22
 10 : 29
 09 : 43
Sonny G
Updated on September 08, 2021Comments
-
 Sonny G over 1 year
How do I hide the x-axis label/text that is displayed in chart.js ?
Setting
scaleShowLabels:falseonly removes the y-axis labels.<script> var options = { scaleFontColor: "#fa0", datasetStrokeWidth: 1, scaleShowLabels : false, animation : false, bezierCurve : true, scaleStartValue: 0, }; var lineChartData = { labels : ["1","2","3","4","5","6","7"], datasets : [ { fillColor : "rgba(151,187,205,0.5)", strokeColor : "rgba(151,187,205,1)", pointColor : "rgba(151,187,205,1)", pointStrokeColor : "#fff", data : [1,3,0,0,6,2,10] } ] } var myLine = new Chart(document.getElementById("canvas").getContext("2d")).Line(lineChartData,options); </script> -
 giammin almost 8 yearsplease downvoter tell me how to improve my answer, thanks
 -
 IOrlandoni almost 8 yearsDoes not work. Commenting the labels out makes the chart throw an error on update.
 -
giammin almost 8 years@OhCaN this answer was written when the current version of chartjs was v1.0 beta i have running implementations with that code and they all work fine.
-
 Nicholas-c almost 8 yearsWorked perfectly; You are a life saver!
 -
 Charlie Martin over 7 yearsNewer highchart version? This question is about chart.js. Not highcharts.
 -
 Thiago Duarte over 7 yearsThis would remove the y axis scale also.
 -
 Samuele over 7 yearsI solved it inserting those lines BEFORE :this.buildScale(data.labels); Line: 2375. var newLabels=[]; for(var i=0;i<data.labels.length;i++){ newLabels.push(''); } Then change also with: this.buildScale(newLabels);
 -
 StackUnder almost 7 yearsUsing Version: 2.1.6, this one did the trick. Also, without using global you could:
options:{ legend: { display: false, }, -
 István Pálinkás over 6 yearsIf I'm right, this solution also removes the "background grid" ( I don't know the proper reference, the gray bars behind the graph ). Is there a solution that only removes the "labels" as OP requested?
 -
 Legends over 6 yearsNothing of the above mentioned works for my bar chart, chart.js 2.4.0. --> and also avoid to pass the labels. This should really be only a switch, so passing labels shouldn't be a concern here. Waiting for chart.js 3.x :)
 -
Legends over 6 yearsperfect ! that's what I am looking for. But it has to be set before the chart is rendered. Doesn't work afterwards...
-
 Darin Cardin over 5 yearsI am using ng2-charts 1.5.0 and this code works fine.
 -
 Billu over 5 years@giammin, your script is not working in my case, can we discuss.
 -
giammin over 5 years@user123 this is a really old answer and i have not used highcharts since them... i dont think i can help you, sorry
-
 Matt K almost 5 yearsAs @StevenPalinkas noted this will remove all the x-axis grid lines as well as the label text. Not ideal.
 -
giammin almost 5 years@MattK you are right. I updated my answer accordingly. Thanks
-
 Rachel Martin over 3 yearsscaleFontSize is not a valid property
 -
 Anton Krug about 2 yearsSo it's like @giammin answer, but for the newer versions?
 -
 Denismr7 about 2 yearsYes, I use chart.js 3.0.2 and that works for me