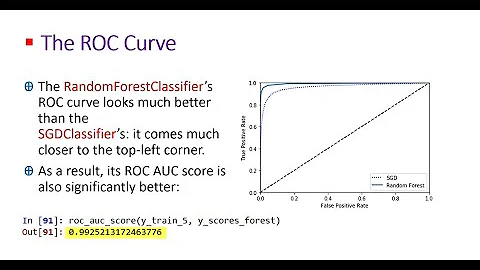
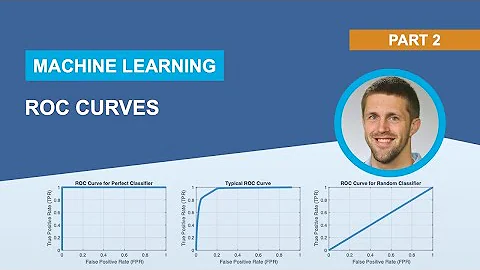
ROC curve for a binary classifier in MATLAB
Use perfcurve:
[X,Y] = perfcurve(labels,scores,posclass);
plot(X,Y);
labels are the true labels of the data, scores are the output scores from your classifier (before the threshold) and posclass is the positive class in your labels.
Related videos on Youtube
Matin Kh
I have a PhD in Computer Science and am a software engineer at Google. Previously, I was a research assistant at the University of Florida and a research scientist intern at Philips Research North America. I was also a teaching assistant for Analysis of Algorithms Data Mining Database Management Systems I am interested in algorithms, programming, machine learning, and statistics.
Updated on June 04, 2022Comments
-
 Matin Kh almost 2 years
I have a binary classifier, which classifies an input X as class zero if its predicted value is below some threshold (say
T), and one otherwise.
I have all predicted and actual values for every input. So I can have both predicted class and actual class of an input.Now I want to have the ROC curve for this classifier with MATLAB. How should I do it?
-
 Matin Kh over 10 yearsWhat do
XandYrepresent? -
lennon310 over 10 years@MatinKh X is false positive rate, Y is true positive rate by default. You can change them as well. Check this page: mathworks.com/help/stats/perfcurve.html
-
Ran over 10 years@MatinKh
XandYare the values for the axis of the ROC plot. -
TariqS almost 4 years@Ran You have mentioned that scores are output scores from classifier before applying threshold. Then how do we apply threshold


