subplot with pandas dataframes
11,092
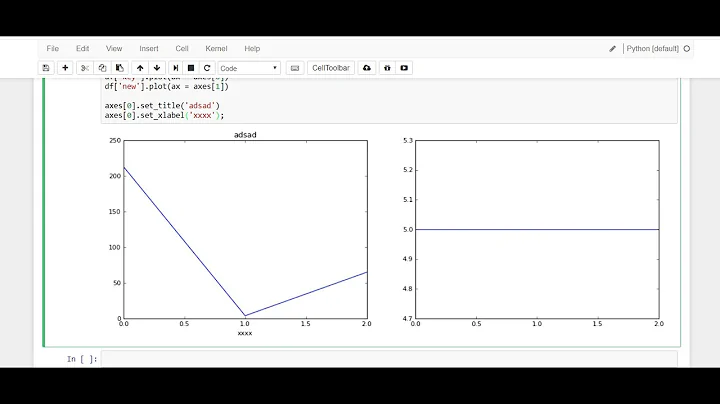
You plot against Axes, not Figures. Pandas really has nothing to do with plotting/matplotlib. Pandas devs simply added a quick interface to matplotlib for convenience.
You really should learn to use matplotlib without going through pandas first. But for your problem at hand, you simply need to pass the Axes objects to the dataframe's plot method.
fig, axes = plt.subplots(nrows=2, ncols=1)
df1.plot(..., ax=axes[0, 0])
df2.plot(..., ax=axes[1, 0])
Related videos on Youtube
 03 : 29
010b Subplots from pandas DataFrames
 21 : 22
Matplotlib Tutorial (Part 10): Subplots
 12 : 30
How to plot multiple sub-plots using Matplotlib and Seaborn | Session With Sumit
 10 : 45
Python Pandas and Subplots
 10 : 11
Pandas Plot - How to Use the MatPlotLib Subplot function
 16 : 08
Matplotlib Tutorial - Subplots and InnerPlots
Author by
yoshiserry
Updated on May 25, 2022Comments
-
yoshiserry almost 2 years
I would like to create multiple subplot on a figure using a pandas dataframe (called df).
My original plot is here:
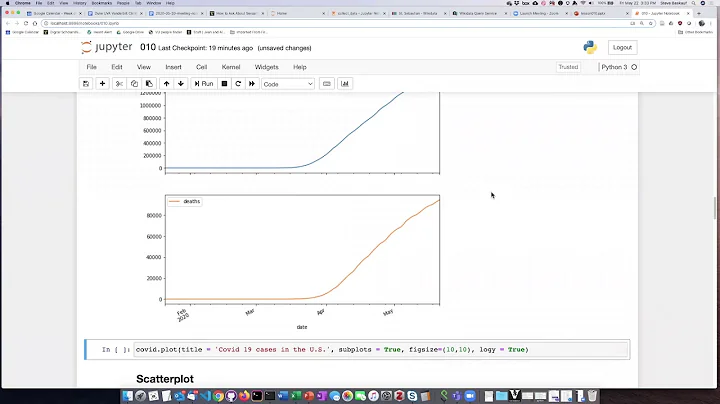
df.plot(x='month', y='number', title='open by month',color="blue")I've tried multiple attempts at the "working with figures and subplots" section of this site pyplot tutorial from matplotlib
[ 1 ]
plt.figure(1)
df.plot.(figure(1), sublot(211), x='month', y='number', title='open byXXX"
df.plot.(figure(1), sublot(212), x='month', y='number', title='open byXXX"
[ 2 ]
plt.figure(1)
df.plot.subplot(211)(x='month', y='number', title='open byXXX")
df.plot.subplot(212)(x='month', y='number', title='open byXXX")