Swap usage too high?
Solution 1
You can't swapoff because the amount of swapped memory can't be overtaken by your RAM. You are getting legitimate error message.
Small snippet.
if (!quiet || errno == ENOMEM)
    warn(_("%s: swapoff failed"), orig_special);

return -1;
In my opinion, your workload increases your RAM demand. You are running a workload that requires more memory. Usage of the entire swap indicates that. Also, changing swappiness to 1 might not be a wise decision. Setting swappiness to 1 does not indicate that swapping will not be done. It just indicates how aggressive kernel will be in respect of swapping, it does not eliminate swapping. Swapping will happen if needs to be done.
Also, I don't know why you are trying to disable swap. Unless you have tons and tons of RAM, you should not disable swap.
Of course, you can reboot and swap usage will be zero then. And you can safely swapoff then. But, that doesn't solve the problem in long term.
Would you mind, posting the /proc/meminfo output.
Solution 2
One possible reason would be for your /tmp to be mounted on tmpfs, i.e. on a file system backed by memory.
If this is the case (df -hT /tmp), just remove/relocate files staying there, make sure no application fills again /tmp (or any file system mounted on tmpfs: df -ht tmpfs) and this problem will be solved.
Solution 3
Note that it is actually not bad if the system swaps out memory to the swap and uses the memory for buffers instead. This probably indicates two things:
- you do have a number of applications running (~500 MB) that are not used a lot
- you use other applications that read/write a lot of data, more than the 1 GB of RAM that you have. The system tries to improve performance for these applications by buffering hard disk data in memory for faster access
Yes, it may appear that you only have ~600 MB memory in use. What is causing the system to swap is probably not an overly memory exhaustive application, but a very I/O heavy workload hitting the buffers. Can you identify which process is doing all the I/O? What are you using the server for?
Solution 4
I do not know of a tool that gives you the swap size on a per process basis, but it would be easy enough to write one... (see shell script example further down)
Linux comes with a tool named smem. To install under Debian/Ubuntu you should be able to use (it will install many python packages in the process):
apt-get install smem
Then to use it, just type smem on your command line.
The other solution to find out how much a process current swap usage is, you want to check out the VmSwap parameter in the process status file.
Using top or htop or ps or pgrep or pidof... determine the process identifier (PID) and then look at the status file:
$ pidof myprocess
123
$ cat /proc/123/status
This includes information about the memory currently used by the process. There is an example:
Name:   snapinit
State:  S (sleeping)
Tgid:   2769
Ngid:   0
Pid:    2769
PPid:   1
TracerPid:  0
Uid:    0   0   0   0
Gid:    0   0   0   0
FDSize: 64
Groups:
NStgid: 2769
NSpid:  2769
NSpgid: 2765
NSsid:  2765
VmPeak:   141952 kB
VmSize:   141952 kB
VmLck:         0 kB
VmPin:         0 kB
VmHWM:     11552 kB
VmRSS:      3444 kB
VmData:      772 kB
VmStk:       136 kB
VmExe:       244 kB
VmLib:     62356 kB
VmPTE:       208 kB
VmPMD:        12 kB
VmSwap:     1968 kB
HugetlbPages:          0 kB
Threads:    1
SigQ:   0/3912
SigPnd: 0000000000000000
ShdPnd: 0000000000000000
SigBlk: 0000000000014006
SigIgn: 0000000000001000
SigCgt: 00000001800004c8
CapInh: 0000000000000000
CapPrm: 0000003fffffffff
CapEff: 0000003fffffffff
CapBnd: 0000003fffffffff
CapAmb: 0000000000000000
Seccomp:    0
Cpus_allowed:   1
Cpus_allowed_list:  0
Mems_allowed:   00000000,00000001
Mems_allowed_list:  0
voluntary_ctxt_switches:    36
nonvoluntary_ctxt_switches: 23
The section of interest is the one showing Vm<name> parameters (i.e. virtual memory which is the only kind of memory available to a process, only the kernel deals with real physical memory; the VM is created by your MMU):
VmPeak:   141952 kB
VmSize:   141952 kB
VmLck:         0 kB
VmPin:         0 kB
VmHWM:     11552 kB
VmRSS:      3444 kB
VmData:      772 kB
VmStk:       136 kB
VmExe:       244 kB
VmLib:     62356 kB
VmPTE:       208 kB
VmPMD:        12 kB
VmSwap:     1968 kB
In my case, I see that the swap memory (VmSwap) used by this process alone is 1968Kb, nearly 2Mb.
The VmLib parameter shows the amount of memory used for shared libraries (.so files). Although this look huge, remember that the memory used by shared libraries is... shared between all processes.
In a shell, you may retrieve the parameters with a command line like this:
#!/bin/sh
echo "  NAME                        PID        SWAP"
for PID in /proc/[0-9]*
do
  if stat $PID/status >/dev/null
  then
    # get name of process
    procname=`grep 'Name:' $PID/status | awk -e '{ print $2 };'`
    # get amount of swap in use by that process
    procswap=`grep 'VmSwap:' $PID/status | awk -e '{ print $2 };'`

    printf "%-21s %11d %11d\n" $procname `basename $PID` $procswap
  fi
done
Note that the $PID/status file will disappear when a process dies and this for loop does not check that properly. Also some files cannot be read by a normal user (i.e. if you are root, you'll see a result for each process, otherwise some processes just return an error or 0Kb.)
There is a sample output. The SWAP data is in Kilo Bytes.
  NAME                        PID        SWAP
systemd                         1         348
watchdog/0                     10           0
ipv6_addrconf                 106           0
ureadahead                  13234          28
gnome-calculato             13997           0
apache2                     14175        7240
freshclam                    1447        3072
systemd-logind               1449         244
Related videos on Youtube
![How To Fix High RAM/Memory Usage on Windows 10 [Complete Guide]](https://i.ytimg.com/vi/osKnDbHibig/hq720.jpg?sqp=-oaymwEcCNAFEJQDSFXyq4qpAw4IARUAAIhCGAFwAcABBg==&rs=AOn4CLDgajRq6bP7JD1erNguFVloL0gqUA) 12 : 54
12 : 54
 03 : 38
 02 : 54
 12 : 19
 05 : 02
STenyaK
Updated on September 18, 2022Comments
-
STenyaK almost 2 years
I have a Debian Sid box, freshly installed about a month ago, with no desktop apps running at the moment.
Any command I try to run (via ssh) makes the hard disk work very hard. The system worked flawlessly a few weeks ago while running Ubuntu 8.04. Hardware should be ok, smart tools report no problem, nor do memory checks, etc.
I suspect the problem is related to swapping:
$ free -h
             total       used       free     shared    buffers     cached
Mem:          998M       986M        12M         0B       464K       904M
-/+ buffers/cache:        81M       917M
Swap:         511M       511M         0B
Testing stuff, I see that I'm unable to disable swap without rebooting, even though most physical ram is used for caches:
# swapoff  -a
swapoff: /swapfile: swapoff failed: Cannot allocate memory
When running the script mentioned in this stackoverflow answer, the highest swap-using process was using barely 1.5megs, and the total count was:
"Overall swap used: 18376 kB"...which is far from the half gig that htop or free report.
I tried changing the
swappinessto1half a month ago, but there's no difference (same memory usage patterns).Any idea what could be the culprit?
Edit: here's the
/proc/meminfocontents (similar situation, but 702megs of cache instead of 904, and chromium still open):MemTotal: 1022464 kB MemFree: 14344 kB Buffers: 192 kB Cached: 719816 kB SwapCached: 2212 kB Active: 304304 kB Inactive: 657344 kB Active(anon): 294128 kB Inactive(anon): 651264 kB Active(file): 10176 kB Inactive(file): 6080 kB Unevictable: 0 kB Mlocked: 0 kB HighTotal: 127336 kB HighFree: 316 kB LowTotal: 895128 kB LowFree: 14028 kB SwapTotal: 524284 kB SwapFree: 0 kB Dirty: 4 kB Writeback: 0 kB AnonPages: 239528 kB Mapped: 11968 kB Shmem: 703760 kB Slab: 28924 kB SReclaimable: 12116 kB SUnreclaim: 16808 kB KernelStack: 2200 kB PageTables: 5812 kB NFS_Unstable: 0 kB Bounce: 0 kB WritebackTmp: 0 kB CommitLimit: 1035516 kB Committed_AS: 2193368 kB VmallocTotal: 122880 kB VmallocUsed: 14092 kB VmallocChunk: 105548 kB HardwareCorrupted: 0 kB AnonHugePages: 0 kB HugePages_Total: 0 HugePages_Free: 0 HugePages_Rsvd: 0 HugePages_Surp: 0 Hugepagesize: 2048 kB DirectMap4k: 911352 kB DirectMap2M: 0 kBAnd here's the
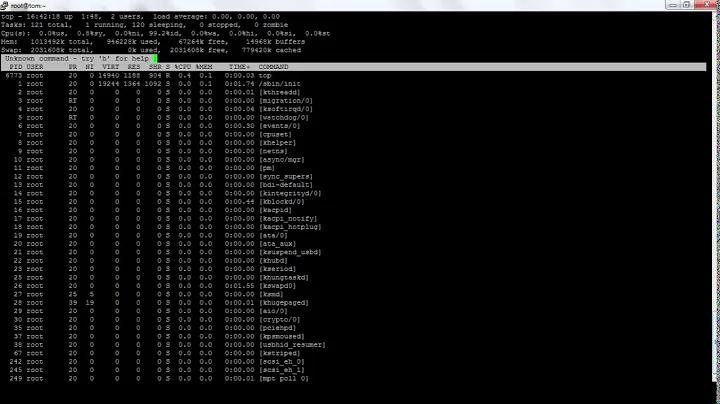
top -b -n 1output:top - 22:00:18 up 1 day, 2:34, 4 users, load average: 1,97, 1,25, 0,88 Tasks: 137 total, 3 running, 134 sleeping, 0 stopped, 0 zombie %Cpu(s): 4,9 us, 3,0 sy, 2,7 ni, 83,2 id, 6,1 wa, 0,0 hi, 0,0 si, 0,0 st KiB Mem: 1022464 total, 1008788 used, 13676 free, 188 buffers KiB Swap: 524284 total, 524284 used, 0 free, 719792 cached PID USER PR NI VIRT RES SHR S %CPU %MEM TIME+ COMMAND 7861 stenyak 20 0 6336 1252 976 R 18,0 0,1 0:00.03 top 5194 isabel 30 10 44372 5344 1404 R 12,0 0,5 0:36.11 glmatrix 17940 root 20 0 103m 6844 2828 S 6,0 0,7 11:02.21 Xorg 1 root 20 0 2280 28 0 S 0,0 0,0 0:02.49 init 2 root 20 0 0 0 0 S 0,0 0,0 0:00.00 kthreadd 3 root 20 0 0 0 0 S 0,0 0,0 0:15.25 ksoftirqd/0 5 root 20 0 0 0 0 S 0,0 0,0 0:00.00 kworker/u:0 6 root rt 0 0 0 0 S 0,0 0,0 0:00.93 migration/0 7 root rt 0 0 0 0 S 0,0 0,0 0:00.46 watchdog/0 8 root rt 0 0 0 0 S 0,0 0,0 0:00.73 migration/1 10 root 20 0 0 0 0 S 0,0 0,0 0:17.30 ksoftirqd/1 12 root rt 0 0 0 0 S 0,0 0,0 0:00.43 watchdog/1 13 root 0 -20 0 0 0 S 0,0 0,0 0:00.00 cpuset 14 root 0 -20 0 0 0 S 0,0 0,0 0:00.00 khelper 15 root 20 0 0 0 0 S 0,0 0,0 0:00.00 kdevtmpfs 16 root 0 -20 0 0 0 S 0,0 0,0 0:00.00 netns 17 root 20 0 0 0 0 S 0,0 0,0 0:00.44 sync_supers 18 root 20 0 0 0 0 S 0,0 0,0 0:00.00 bdi-default 19 root 0 -20 0 0 0 S 0,0 0,0 0:00.00 kintegrityd 20 root 0 -20 0 0 0 S 0,0 0,0 0:00.00 kblockd 22 root 20 0 0 0 0 S 0,0 0,0 0:00.07 khungtaskd 23 root 20 0 0 0 0 D 0,0 0,0 2:50.47 kswapd0 24 root 25 5 0 0 0 S 0,0 0,0 0:00.00 ksmd 25 root 20 0 0 0 0 S 0,0 0,0 0:00.00 fsnotify_mark 26 root 0 -20 0 0 0 S 0,0 0,0 0:00.00 crypto 99 root 20 0 0 0 0 S 0,0 0,0 0:00.00 khubd 115 root 0 -20 0 0 0 S 0,0 0,0 0:00.00 ata_sff 116 root 20 0 0 0 0 S 0,0 0,0 0:00.00 scsi_eh_0 117 root 20 0 0 0 0 S 0,0 0,0 0:00.00 scsi_eh_1 118 root 20 0 0 0 0 S 0,0 0,0 0:01.66 kworker/u:1 152 root 20 0 0 0 0 S 0,0 0,0 0:02.12 jbd2/sda1-8 153 root 0 -20 0 0 0 S 0,0 0,0 0:00.00 ext4-dio-unwrit 280 root 20 0 2944 352 128 S 0,0 0,0 0:00.30 udevd 423 root 0 -20 0 0 0 S 0,0 0,0 0:00.00 hd-audio0 1286 root 20 0 0 0 0 S 0,0 0,0 0:07.06 jbd2/sda2-8 1287 root 0 -20 0 0 0 S 0,0 0,0 0:00.00 ext4-dio-unwrit 1561 root 20 0 0 0 0 S 0,0 0,0 0:03.09 flush-8:0 1603 root 20 0 2376 48 0 S 0,0 0,0 0:00.33 rpcbind 1634 statd 20 0 2648 68 64 S 0,0 0,0 0:00.00 rpc.statd 1639 root 0 -20 0 0 0 S 0,0 0,0 0:00.00 rpciod 1641 root 0 -20 0 0 0 S 0,0 0,0 0:00.00 nfsiod 1648 root 20 0 2576 0 0 S 0,0 0,0 0:00.00 rpc.idmapd 2019 root 20 0 29088 976 0 S 0,0 0,1 0:22.26 rsyslogd 2123 root 20 0 1876 84 24 S 0,0 0,0 0:00.23 acpid 2161 message+ 20 0 3756 728 0 S 0,0 0,1 0:02.06 dbus-daemon 2213 daemon 20 0 2152 20 0 S 0,0 0,0 0:00.00 atd 2231 root 20 0 4488 220 128 S 0,0 0,0 0:00.00 bluetoothd 2242 root 10 -10 0 0 0 S 0,0 0,0 0:00.00 krfcommd 2259 avahi 20 0 3272 292 168 S 0,0 0,0 0:00.66 avahi-daemon 2262 avahi 20 0 3156 24 0 S 0,0 0,0 0:00.00 avahi-daemon 2265 root 20 0 5968 180 152 S 0,0 0,0 0:00.00 bitlbee 2271 root 20 0 0 0 0 S 0,0 0,0 0:11.69 kworker/0:2 2304 root 20 0 19056 700 220 S 0,0 0,1 0:00.75 NetworkManager 2334 root 20 0 5536 176 108 S 0,0 0,0 0:02.86 cron 2350 root 20 0 6700 492 152 S 0,0 0,0 0:00.01 sudo 2351 root 20 0 15304 5880 1428 R 0,0 0,6 61:42.79 iotop 2359 root 20 0 24256 600 56 S 0,0 0,1 0:01.12 polkitd 2390 root 20 0 6892 368 180 S 0,0 0,0 0:00.15 modem-manager 2392 root 20 0 7536 80 0 S 0,0 0,0 0:00.13 cupsd 2396 root 20 0 20964 516 296 S 0,0 0,1 0:00.15 gdm3 2712 root 20 0 10068 196 84 S 0,0 0,0 0:11.72 kerneloops 2714 root 20 0 6896 2108 372 S 0,0 0,2 0:05.69 ddclient - slee 2802 Debian-+ 20 0 7424 100 40 S 0,0 0,0 0:00.05 exim4 2877 daemon 20 0 1868 236 172 S 0,0 0,0 0:01.22 uptimed 2881 root 20 0 6464 208 104 S 0,0 0,0 0:00.27 sshd 2913 root 20 0 1848 72 8 S 0,0 0,0 0:00.00 minissdpd 2936 root 20 0 4328 40 36 S 0,0 0,0 0:00.00 getty 2937 root 20 0 4328 40 36 S 0,0 0,0 0:00.00 getty 2938 root 20 0 4328 40 36 S 0,0 0,0 0:00.00 getty 2939 root 20 0 4328 40 36 S 0,0 0,0 0:00.00 getty 2940 root 20 0 4328 40 36 S 0,0 0,0 0:00.00 getty 2941 root 20 0 4328 40 36 S 0,0 0,0 0:00.00 getty 2961 root 20 0 23384 540 156 S 0,0 0,1 0:00.88 accounts-daemon 2965 root 20 0 29216 292 64 S 0,0 0,0 0:01.35 console-kit-dae 3050 root 20 0 27408 320 0 S 0,0 0,0 0:00.48 upowerd 3115 stenyak 20 0 6260 320 84 S 0,0 0,0 0:00.51 screen 3119 stenyak 20 0 6260 248 40 S 0,0 0,0 0:00.61 screen 3121 stenyak 20 0 6260 132 16 S 0,0 0,0 0:00.48 screen 3124 stenyak 20 0 6388 1004 572 S 0,0 0,1 1:33.81 p2p.sh 3125 stenyak 20 0 34176 5604 1764 S 0,0 0,5 1:57.10 quasselcore 3129 stenyak 20 0 55268 2972 652 S 0,0 0,3 3:00.32 bot.py 3280 rtkit 21 1 18980 180 64 S 0,0 0,0 0:01.23 rtkit-daemon 3367 root 20 0 0 0 0 S 0,0 0,0 0:00.00 kauditd 3684 root 20 0 2940 340 112 S 0,0 0,0 0:00.00 udevd 3685 root 20 0 2940 208 0 S 0,0 0,0 0:00.00 udevd 5845 root 20 0 6444 904 592 S 0,0 0,1 0:00.00 cron 5876 stenyak 20 0 1932 428 368 S 0,0 0,0 0:00.00 sh 5878 stenyak 20 0 6048 1232 1080 S 0,0 0,1 0:00.00 memmon.sh 7857 stenyak 20 0 5060 508 448 S 0,0 0,0 0:00.00 sleep 9071 root 20 0 9816 860 200 S 0,0 0,1 0:00.10 sshd 9080 stenyak 20 0 10180 1112 136 S 0,0 0,1 0:06.93 sshd 9081 stenyak 20 0 9280 3232 148 S 0,0 0,3 0:00.62 bash 9436 root 20 0 7396 1188 684 S 0,0 0,1 0:07.05 bitlbee 10285 root 20 0 0 0 0 S 0,0 0,0 0:00.00 kworker/1:0 12728 stenyak 20 0 7960 2960 648 S 0,0 0,3 23:35.01 htop 12950 root 20 0 9832 80 76 S 0,0 0,0 0:00.08 sshd 12955 stenyak 20 0 9832 0 0 S 0,0 0,0 0:00.04 sshd 12956 stenyak 20 0 9304 36 32 S 0,0 0,0 0:00.64 bash 17939 root 20 0 23284 1080 320 S 0,0 0,1 0:00.11 gdm-simple-slav 18062 root 20 0 29808 964 364 S 0,0 0,1 0:00.38 gdm-session-wor 20066 root 20 0 0 0 0 S 0,0 0,0 0:09.72 kworker/0:0 28369 isabel 20 0 1932 112 108 S 0,0 0,0 0:00.03 sh 28404 isabel 20 0 3868 260 68 S 0,0 0,0 0:00.20 ssh-agent 28407 isabel 20 0 3516 0 0 S 0,0 0,0 0:00.00 dbus-launch 28408 isabel 20 0 3420 304 116 S 0,0 0,0 0:00.24 dbus-daemon 28416 isabel 20 0 6344 744 548 S 0,0 0,1 0:00.29 xfconfd 28422 isabel 20 0 8336 496 248 S 0,0 0,0 0:01.46 xscreensaver 28424 isabel 20 0 21932 580 340 S 0,0 0,1 0:00.17 xfce4-session 28430 isabel 20 0 24392 2032 1160 S 0,0 0,2 0:16.32 xfwm4 28432 isabel 20 0 117m 2072 908 S 0,0 0,2 0:01.26 xfce4-panel 28434 isabel 20 0 22520 256 256 S 0,0 0,0 0:00.06 Thunar 28436 isabel 20 0 21016 688 460 S 0,0 0,1 0:00.06 xfsettingsd 28437 isabel 20 0 119m 3344 1312 S 0,0 0,3 0:03.50 xfdesktop 28441 isabel 20 0 21072 272 268 S 0,0 0,0 0:00.07 kerneloops-appl 28443 isabel 20 0 29816 540 228 S 0,0 0,1 0:00.10 polkit-gnome-au 28450 isabel 20 0 263m 544 276 S 0,0 0,1 0:00.30 xfce4-volumed 28452 isabel 20 0 63936 488 0 S 0,0 0,0 0:00.31 tracker-store 28457 isabel 20 0 23240 768 472 S 0,0 0,1 0:00.18 xfce4-settings- 28460 isabel 9 -11 99532 500 248 S 0,0 0,0 0:00.38 pulseaudio 28470 isabel 20 0 21936 612 312 S 0,0 0,1 0:00.20 panel-6-systray 28472 isabel 20 0 339m 1348 552 S 0,0 0,1 0:00.42 xfce4-mixer-plu 28473 isabel 20 0 22028 2292 1740 S 0,0 0,2 0:59.33 xfce4-oragecloc 28514 isabel 20 0 371m 21m 2428 S 0,0 2,1 3:46.22 chromium 28517 isabel 20 0 111m 3020 288 S 0,0 0,3 0:00.58 chromium 28518 isabel 20 0 1948 64 0 S 0,0 0,0 0:00.00 chromium-sandbo 28519 isabel 20 0 120m 3324 288 S 0,0 0,3 0:00.20 chromium 28522 isabel 20 0 128m 3252 204 S 0,0 0,3 0:00.01 chromium 28558 isabel 20 0 208m 52m 476 S 0,0 5,3 1:25.92 chromium 28573 isabel 20 0 271m 103m 1244 S 0,0 10,3 3:01.64 chromium 28693 isabel 20 0 120m 3836 628 S 0,0 0,4 0:43.86 chromium 28696 isabel 20 0 83088 6412 108 S 0,0 0,6 0:16.55 GoogleTalkPlugi 28706 isabel 20 0 159m 6896 972 S 0,0 0,7 9:00.72 chromium 32332 root 20 0 0 0 0 S 0,0 0,0 0:06.24 kworker/1:2 32351 stenyak 9 -11 99108 1032 192 S 0,0 0,1 0:00.51 pulseaudio 32455 root 20 0 9816 108 76 S 0,0 0,0 0:00.11 sshd 32460 stenyak 20 0 9992 264 144 S 0,0 0,0 0:07.43 sshd 32462 stenyak 20 0 9300 1976 108 S 0,0 0,2 0:01.31 bash-
 Admin over 11 years@DavidSchwartz no, other than uninstalling non-critical stuff (like munin, apache...) I did nothing else.
 -
Admin over 11 years@ThorbjørnRavnAndersen no process is using those amounts of memory (neither VIRT, RES nor SHR), not even close to half a gig, so I have no idea what to kill. Again, the total used memory -/+buffers/cache is just 81megs, (and apparently only 18megs of swap are used by actual processes?).
-
Admin over 11 yearsYou have a 511 MB swap partition which us fully used! Not just 18. Trust
free. -
Admin over 11 yearsYes, but I have no idea how to trace the swap usage back to a process[es] that I can kill. top doesn't say anything usefull, all the scripts at stackoverflow regarding swap usage seem to lie, and I really have no idea where the swap is being used, specially when all users close their X session and swap is still used :-/
-
-
STenyaK over 11 yearsI'm waiting for the swap to fill again (depends on computer usage, which is lower these days). I tried to disable swap only in order to try/check if RAM caches would be dropped (from what I read on the net, those 904megs of cache should be discarded when more RAM is needed; and I'd need 511megs of RAM in order to disable swap).
-
STenyaK over 11 yearsAt the time of low memory usage, the only graphical application running is gdm3. Previously (before the user logged out), an xfce desktop was running, with barely any widgets, and only chromium-browser showing on its task manager. When it happens again, I'll use iotop to look for I/O intensive processes. Thanks for the suggestion.
-
Thorbjørn Ravn Andersen over 11 yearsI/O heaviness should not by itself result in swapping. You use a stock kernel? If yes, it must be a user program with a memory leak.
-
 Has QUIT--Anony-Mousse over 11 yearsI found Chrome pretty much unusable with just 1 GB of RAM. Sure it is fast and has sandboxing, put you pay for that with memory intensiveness. But that wouldn't explain why your system uses 900 MB for caching.
 -
STenyaK over 11 years@ThorbjørnRavnAndersen the kernel is the stock one:
3.2.0-4-686-pae #1 SMP Debian 3.2.32-1 i686 GNU/LinuxAny idea how to track a possible memory leak to the originator process when top does not show anything unusual? -
STenyaK over 11 yearsThe swap filled again yesterday. Before the user rebooted the computer, a cron-ed script managed to log some information, which I've edited into the original question. Hope that helps.
-
 Stéphane Chazelas over 11 yearsGood point. Data on
tmpfswill typically show as cached. -
STenyaK over 11 yearsDidn't know that! I've added
df -ht tmpfs --totalto my cron-ed debug script. Next time the problem happens, I'll post the output. One question though: should I worry about theUsedcolumn, or theSizecolumn? -
 jlliagre over 11 yearsThe
usedcolumn reports the size of memory used by files. Removing these files will free memory.