What does % utilization mean in htop if only 1 process can execute at a time?
Solution 1
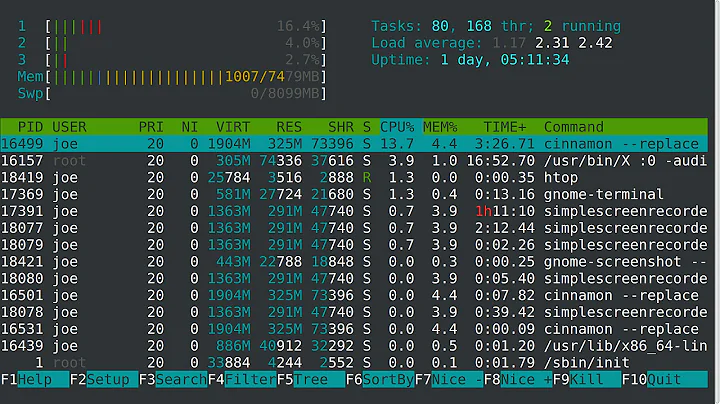
Top shows usage over some time period - by default, something like 3 seconds. It basically tells you what percentage of CPU time a particular process ID used over that interval. And note that this percentage can be over 100% - if you had one process running two threads and keeping both cores of a dual core system busy, you'd see a number around 195% in the %CPU column for that process.
To add some more detail, as the man page explains:
       k: %CPU  --  CPU usage
          The task's share of the elapsed  CPU  time  since  the  last  screen
          update,  expressed as a percentage of total CPU time.  In a true SMP
          environment, if 'Irix mode' is Off, top  will  operate  in  'Solaris
          mode'  where  a task's cpu usage will be divided by the total number
          of CPUs.  You toggle 'Irix/Solaris' modes with the  'I'  interactive
          command.
...
       -d : Delay time interval as:  -d ss.tt (seconds.tenths)
            Specifies the delay between screen updates, and overrides the cor-
            responding value in  one's  personal  configuration  file  or  the
            startup  default.   Later  this can be changed with the 'd' or 's'
            interactive commands.
...
           Global_defaults
              'A' - Alt display      Off (full-screen)
            * 'd' - Delay time       3.0 seconds
              'I' - Irix mode        On  (no, 'solaris' smp)
            * 'p' - PID monitoring   Off
            * 's' - Secure mode      Off (unsecured)
              'B' - Bold disable     Off
So the %CPU column is the percentage of the machine's total CPU time since the last screen update. You can change the time between screen updates either at the command line or interactively, but it defaults to 3 seconds. By default, Irix mode is enabled and the %CPU can be >100% on a multiprocessor system, but Irix mode can be disabled to cause the percentages to be scaled down based on the number of cores.
Solution 2
Short answer
- Linux kernel counts usage in jiffies (CPU time unit),
/proc/<PID>/stattells you how many jiffies has a single process used since its start -
htopcompares two snapshots of summed jiffies (divided by number of CPU threads). The interval between these two time points could be configured using-d --delay=DELAYin tenths of seconds. e.g.1supdate interval (default is1.5s, i.e.-d 15):
htop -d 10
-
100%means that a single process used 1 CPU thread all the time in observed time window (e.g.1.5second). Such value might not be representative in longer period. - You can use +/- keys to modify the update interval
Longer explanation
The best source would be the source code :) (for Linux look for LinuxProcessList_scanCPUTime function).
-
htopreads thePROCSTATFILEwhich points to the overall system stats stored in/proc/stat, you can check it by yourself:
$ cat /proc/stat
For per process values see:
/proc/<PID>/stat
- The first line shows the total CPU usage while in columns we have following values
usertime, nicetime, systemtime, idletime, ioWait, irq, softIrq, steal, guest, guestnice
- Following lines show the same values per each CPU core (thread).
- Total time is computed as:
totaltime = usertime + nicetime + systemalltime + idlealltime + steal + virtalltime
-
totaltimeis divided by number of cpus ($ nprocvalue on Linux).
double period = (double)this->cpus[0].totalPeriod / cpus;
Finally in LinuxProcessList_recurseProcTree the percentage is computed as usage between two timestamps
percent_cpu = (period < 1e-6) ? 0.0f : ((lp->utime + lp->stime - lasttimes) / period * 100.0);
-
utimeCPU time spent in user code, measured in clock ticks -
stimeCPU time spent in kernel code, measured in clock ticks -
lasttimesis the previous "time"lp->utime + lp->stime(in clock ticks)
- Lastly the time units used in this computations relies on jiffies, see
man 7 timefor more information.
t * 100 / jiffy
where jiffy is the number of clock ticks per second, instead of normal time.
jiffy = sysconf(_SC_CLK_TCK);
You can obtain the clock tick value using:
$ getconf CLK_TCK
100
(which means that you can ignore this computation if you're not on special hardware or real-time Linux etc.)
Related videos on Youtube
 07 : 48
 14 : 00
 17 : 57
 04 : 12
 02 : 05
kesari
Updated on September 18, 2022Comments
-
kesari over 1 year
I see that the
htopcommand reports respective the % of utilisation of each CPU core and also that of the processes.We know that only 1 process can execute at a time in the CPU. How is it possible for processes to occupy a certain "Percentage" of the CPU ?
Does it have anything to do with the Instruction Pipeline ?
-
zOs0 almost 10 yearsit's percentage of CPU time that htop is showing
-
 ctrl-alt-delor almost 10 yearsNothing to do with pipeline.
-
-
kesari almost 10 yearsCan you direct me to a reliable and simple article ? ( if you can, include it in the answer) .
-
godlygeek almost 10 years@sssv96: Nothing's more reliable than the man page - I quoted some sections from it to elaborate on my explanation.