Automatic construction of a colormap around the value zero
Solution 1
you can use this tool from the FEX. It generates blue-white-red colormap, with zero always corresponds to white color. For the case you want to include more than two colors, dig into the code and adapt it to your needs.
There are a few more options in the FEX that do similar things (here's one, and another one)...
Solution 2
The color mapping can be controlled using the caxis function (which sets the CLim property of the current axes object). The assumption of course is that a scaled color mapping is in use, as opposed to direct color mapping (read the CDataMapping property). By using a zero-centered range as input, you can ensure that zero is always in the middle.
Here is an example:
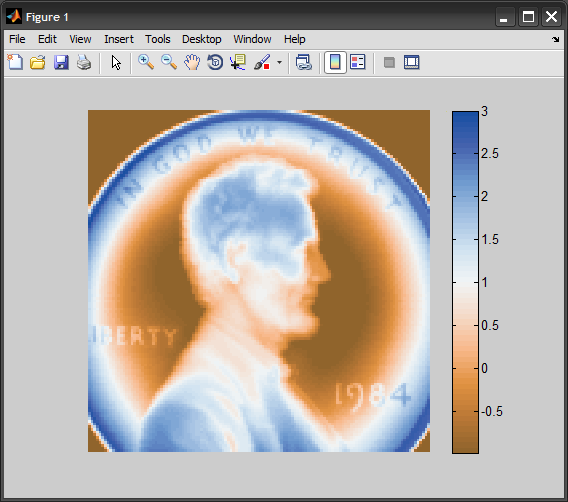
load penny
P = 4*(P./255) - 1;        %# not centered around zero
imagesc(P), axis image off
colormap(lbmap(64,'BrownBlue')), colorbar
Now we adjust the color mapping to make it symmetric around zero:
c = max(abs([min(P(:)),max(P(:))]));
caxis([-c c])
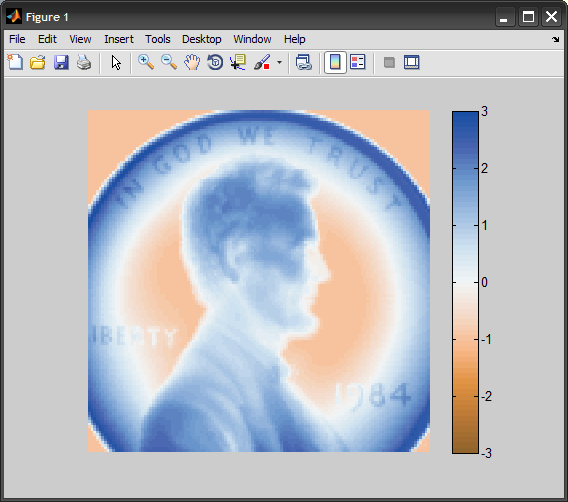
Note that I am using the Light Bartlein color scheme which was designed as a divergent palette to highlight differences between two extremes.
If the original range is very skewed, you might want to resample the colormap to give it more values in the sub-range that is over-stretched.
Solution 3
I like the other answers, especially the one by @Amro. But it looks so complicated :) And your caxis parameters don't need to depend on your input, you can simply grab them from the axis. All this can be a one-liner:
a = gca; % or whatever you use to access your axis handle
a.CLim = max(abs(a.CLim)) * [-1 1];
That's it. This works in MATLAB R2014b onwards, which has the new figure handle system (see more details here). In earlier versions (and new ones, if you prefer), you would use
a = gca; % or whatever you use to access your axis handle
set(a, 'CLim', max(abs(get(a, 'CLim'))) * [-1 1]);
or, using caxis,
a = gca; % or whatever you use to access your axis handle
caxis(a, max(abs(caxis(a))) * [-1 1]);
Automating this is fairly easy as well:
a = gca; % or whatever you use to access your axis handle
addlistener(a, 'CLimMode', 'PostSet', @(h, e) caxis(e.AffectedObject, max(abs(caxis(e.AffectedObject))) * [-1 1]));
This allows you to do this
for ii = -5 : 5
    imagesc([-1 0 10^ii]);
    pause(0.2);
end
and the middle stripe (representing 0) is always the middle color of the colorbar.
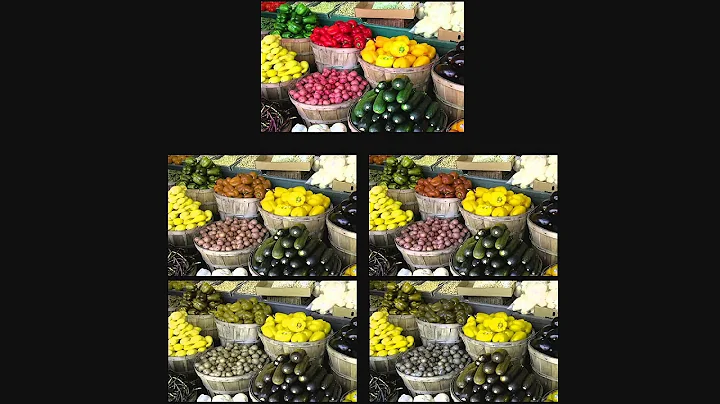
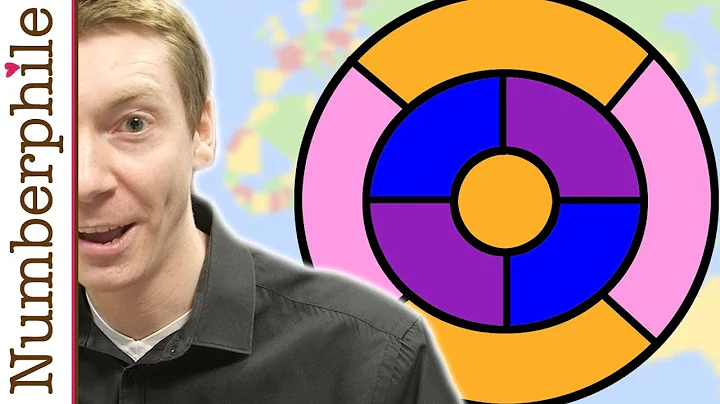
Related videos on Youtube
 08 : 28
 02 : 58
 58 : 28
 13 : 26
 05 : 05
 05 : 58
 10 : 05
 19 : 36
 02 : 25
 01 : 01 : 33
 14 : 18
 09 : 47
Amro
Updated on June 04, 2022Comments
-
 Amro 12 months
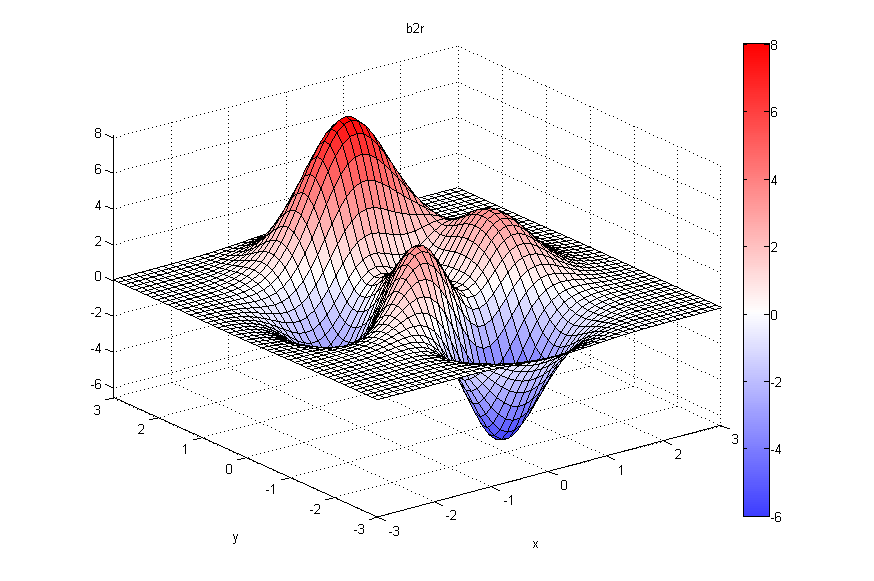
I often want to plot a difference image that ranges from some negative number to some positive one. The issue with that is that matlab's colormaps scale only from the min value to the max value but do not care about some middle value (this case zero). For example, I have produced the
peaksimage with a single pixel different: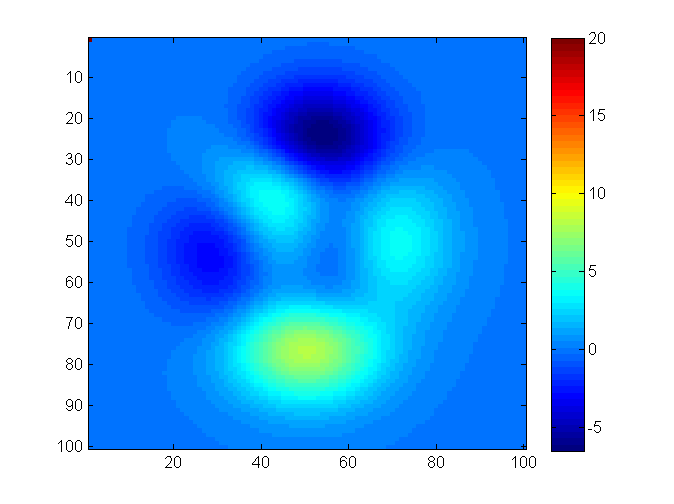
where the original looks like this:
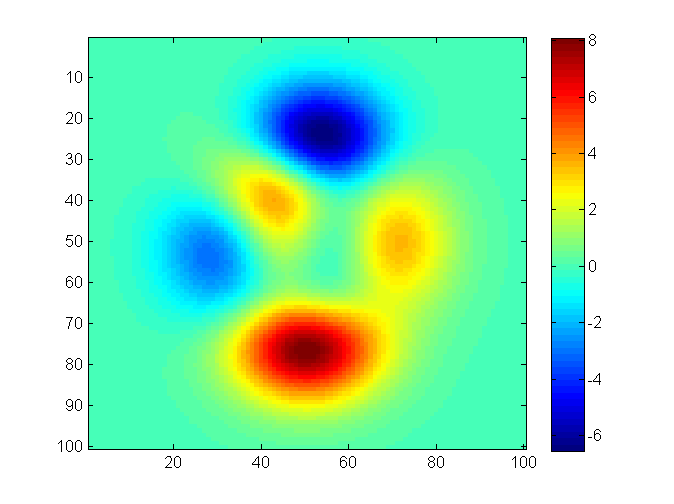
So zero values are blue at the top image and green at the bottom... (using jet colormap as an example)
I'd like to built a colormap that will automatically represent zero values as the same color no matter what will be the min\max values. How can I do that?