Matlab cdfplot: how to control the spacing of the marker spacing
Solution 1
One method is to get XData/YData properties from your curves follow solution (1) from @ephsmith and set it back. Here is an example for one curve.
y = evrnd(0,3,100,1); %# random data
%# original data
subplot(1,2,1)
h = cdfplot(y);
set(h,'Marker','*','MarkerSize',8,'MarkerEdgeColor','r','LineStyle','none')
%# reduced data
subplot(1,2,2)
h = cdfplot(y);
set(h,'Marker','*','MarkerSize',8,'MarkerEdgeColor','r','LineStyle','none')
xdata = get(h,'XData');
ydata = get(h,'YData');
set(h,'XData',xdata(1:5:end));
set(h,'YData',ydata(1:5:end));
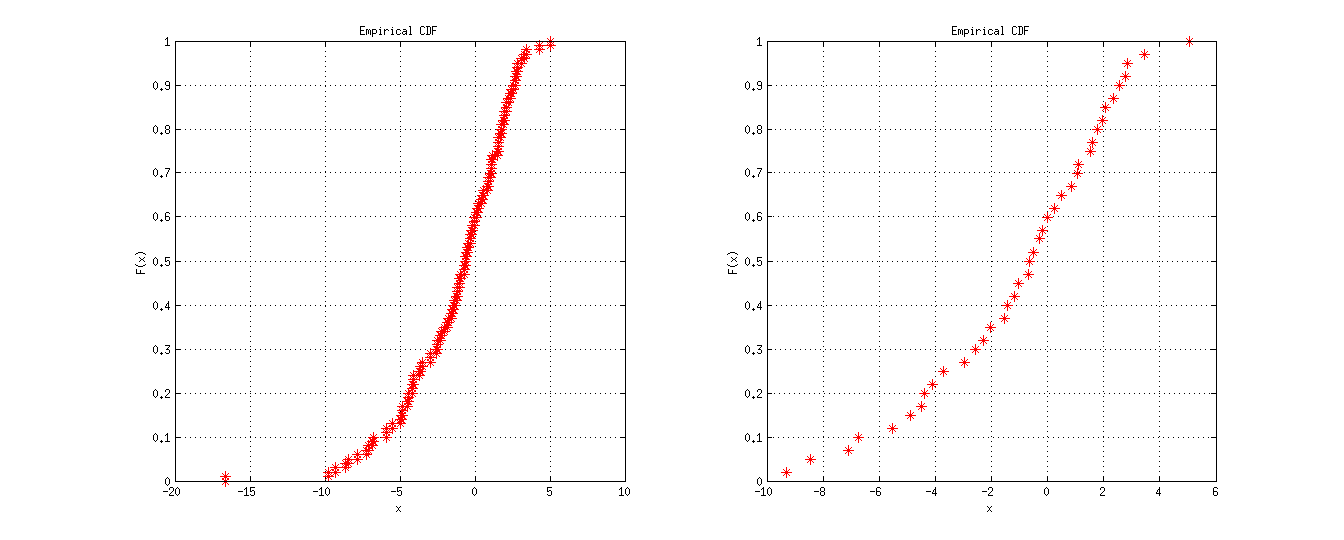
Another method is to calculate empirical CDF separately using ECDF function, then reduce the results before plotting with PLOT.
y = evrnd(0,3,100,1); %# random data
[f, x] = ecdf(y);
%# original data
subplot(1,2,1)
plot(x,f,'*')
%# reduced data
subplot(1,2,2)
plot(x(1:5:end),f(1:5:end),'r*')
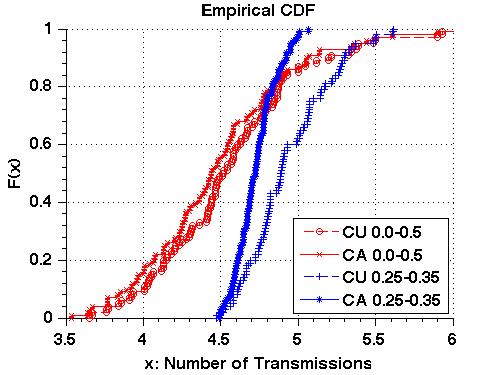
Result
Solution 2
I know this is potentially unnecessary given MATLAB's built-in functions (in the Statistics Toolbox anyway) but it may be of use to other viewers who do not have access to the toolbox.
The empirical CMF (CDF) is essentially the cumulative sum of the empirical PMF. The latter is attainable in MATLAB via the hist function. In order to get a nice approximation to the empirical PMF, the number of bins must be selected appropriately. In the following example, I assume that 64 bins is good enough for your data.
%# compute a histogram with 64 bins for the data points stored in y
[f,x]=hist(y,64);
%# convert the frequency points in f to proportions
f = f./sum(f);
%# compute the cumulative sum of the empirical PMF
cmf = cumsum(f);
Now you can choose how many points you'd like to plot by using the reduced data example given by yuk.
Solution 3
n=20 ; % number of total data markers in the curve graph
M_n = round(linspace(1,numel(y),n)) ; % indices of markers
% plot the whole line, and markers for selected data points
plot(x,y,'b-',y(M_n),y(M_n),'rs')
verry simple.....
Related videos on Youtube
 01 : 53
 03 : 01
 00 : 24
 32 : 35
 18 : 17
 05 : 05
 18 : 31
 22 : 07
 06 : 53
 27 : 39
 05 : 07
alandalusi
Updated on June 04, 2022Comments
-
 alandalusi 12 months
I have a Matlab figure I want to use in a paper. This figure contains multiple cdfplots. Now the problem is that I cannot use the markers because the become very dense in the plot. If i want to make the samples sparse I have to drop some samples from the cdfplot which will result in a different cdfplot line.
How can I add enough markers while maintaining the actual line?
-
alandalusi almost 12 yearsDoesn't work, the density is larger. Besides, I want the figure to look clear in the paper, I need markers to be big enough.
-
alandalusi almost 12 yearsThe problem is that I am plotting CFDPLOT, I do not have the x data. If i use every nth sample, I get different result!
-
 ephsmith almost 12 yearsI understand now. I've added another approach. Sometimes using higher level functions like
cdfplotcan prove troublesome. I've provided an answer that does not depend on any functions that are not built-in to Matlab base.