Debugger settings in CodeBlocks on Mac OS
I'm guessing you've already setup your compiler and I'm assuming this is GCC.
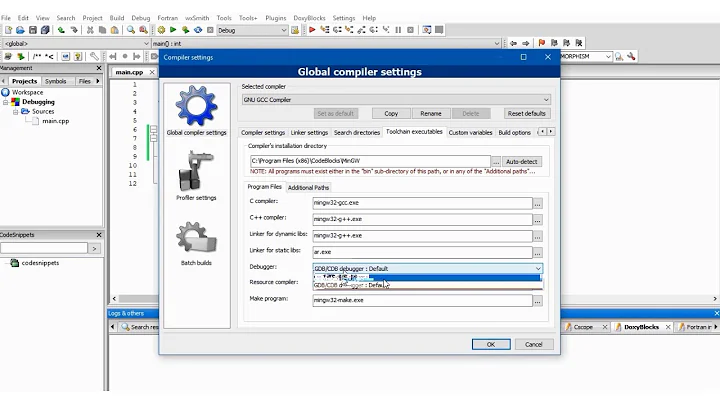
If you go to (Settings > Compiler > Global compiler settings > Toolchain executables), you will probably see something like this:

But instead of a selected debugger, you will probably see a white line which should point to gdb. This is normally in the same folder with the rest of the gcc toolchain.
If you don't have a gdb in that folder, or instead you haven't even set up your compiler, then this link might help you: Codeblocks wiki - Mac section
Related videos on Youtube
 09 : 20
 11 : 47
 08 : 47
 08 : 36
 03 : 23
 07 : 02
 05 : 05
Isa
Updated on September 15, 2022Comments
-
Isa over 1 year
I am a beginner with CodeBlocks on Mac OS, and I have a problem using the debugger. When I try to use it, I have this debugger error message:
ERROR: You need to specify a debugger program in the debuggers's settings. (For GCC compilers, it's 'gdb' (without the quotes))
It is probably due to the lack of the right executable path in the Debugger settings (Settings > debugger > GDB/CDB debugger > Default > Executable path)
Could anyone tell me what should be there? or show me a screenshot of its Debugger settings default window?
I am using: CodeBlocks version 12.11 Mac OS X version 10.9.2
Many thanks for answer to this silly question!
-
Isa about 10 yearsok many thanks, actually I finally realized that in the last version of Mac (Mavericks) gdb was not install by default (as previously) so that gdb was not install, even after downloading Code::Blocks and Xcode...
-
Isa about 10 yearsfor others beginners like me who face this problem, this web page was really useful: