"No source available for main()" error when debugging simple C++ in Eclipse with gdb
Solution 1
I found the answer! And it's embarrassingly simple.
The problem was that I was using the Release version of SDL instead of the Debug version! (I had 'libsdl' from MacPorts whereas I should have had 'libsdl-devel'.)
So my generic answer is: make sure the libs you're linking against were compiled with debug flags set too, it's not always enough to just make sure your own code has them set.
Solution 2
This thread suggests:
-g -O0
for debug flags to be set for Eclipse CDT compilation.
Sometime, it is simple a problem of rebuilding completely the application (like here)
See also this thread describing a similar situation:
I have noticed that sometimes in Eclipse I have to go and specifically add the path to my source files using the "
add filesystem path" (with "search sub-folders") in the Debug Dialog (even when they are in the same project I am debugging), but I have not noticed a pattern to when I have to do this. But it may be worth a try.
Solution 3
Here is another reason for this problem. My configuration used -g3 as the option to gcc. Changing it to -g solved the problem. There seems to be some incompatibility between gcc and gdb. I checked that gdb was the latest revision (using apt-get).
Solution 4
I would like to add a little new blood to this old thread.
I encountered this problem when I tried to compile and debug a gnu arm project.
I solved the problem by modifying the Makefile: adding "-g -O0" at the end of this line "CFLAGS += -Wall -Werror -O3"
Solution 5
Go to project Properties, C/C++ Build -> Settings. On the first tab (Tool Settings) under Cross GCC Compiler click Debugging and set Debug Level to Maximum (-g3)
Related videos on Youtube
thoughton
Updated on July 01, 2021Comments
-
thoughton almost 3 years
I'm having trouble debugging a C++ program in Eclipse (the latest RC of Helios, updated with latest CDT from within itself) on OSX.
The program is very simple (esentially Lesson 2 from NeHe's OpenGL tutorials), consisting of one cpp file and, using OpenGL and Cocoa frameworks, and linking with libSDL.a and libSDLmain.a.
The structure of the project is very simple: the source file(s) are in a subdirectory of the project called src/ and the executable is built to the project's root directory.
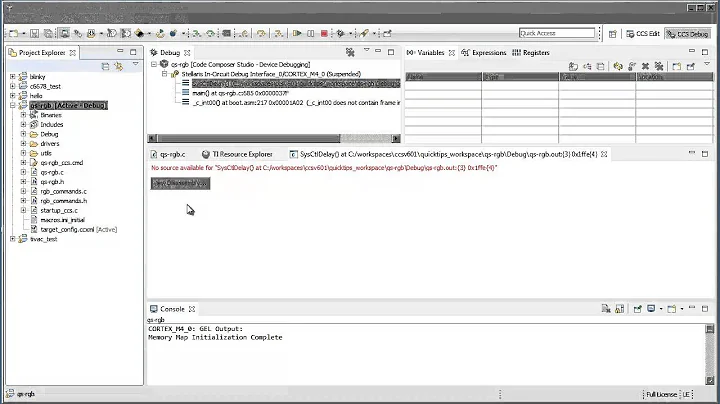
The problem is that whenever I try to add breakpoints and debug it, the breakpoints seem to get hit perfectly but no source is displayed - instead I just get a "No source available for main()" error in the code window.
The compiler flags have optimisations set to none, and both the compiler and linker have the debug symbols flag set (-g).
The debugging setting in Eclipse is set to "Standard spawn progess" and the debugger is set to "gdb".
Now the strangest thing is that if I try to debug the exact same executable - ie. the exact same one that was built by Eclipse - using gdb from the Terminal (shell) then everything works fine. Breakpoints are hit, source code is displayed, no problems at all.
I've made sure that both Eclipse and the shell are using the same gdb executable, and they are (it's /usr/bin/gdb).
Now I may be wrong, but this all suggests to me that there can't be a problem with the compiler and linker flags (because the same executable is debuggable from the shell), so presumably the problem must be with how gdb is being invoked from within Eclipse? Perhaps when run from Eclipse gdb is picking up different config files or something than when it's run from the shell? (Anyone know?)
I'd really appreciate any help with this because it's slowly driving me loopy!
Please let me know if there are any other details that would be useful - exact version numbers of Eclipse/cdt/gdb, exact linker/compiler command lines, etc. - and I'll very gladly update this post with them.
Many thanks in advance,
thoughton.
--- edited @ "14 hours ago" ---
I tried the "add filesystem path" (with "search sub-folders") option, but that didn't work. I also tried creating a new completely flat project, but that didn't work either. I even tried getting a Galileo release (eclipse-SDK-3.5.2RC4 with CDT update), but that made no difference (apart from gdb being slower to launch).
And here's something else strange I noticed: once I get the "No source available" message, if I then switch Eclipse's Console to display the "gdb" console, and also turn on "Verbose console mode" so I can communicate it, I can then issue "l" and "bt" commands and have them work succesfully, showing the correct source and stack where my breakpoint was hit. Which, correct me if I'm wrong, must mean that the information is there and gdb is being invoked correctly - so why will Eclipse not see this information?
I'm getting close to giving up on Eclipse to be honest... I came to it with such high hopes, too.
Any additional help or thoughts would be hugely appreciated.
t.
-
thoughton about 14 yearsThanks for the quick answer. Unfortunately I've already tried both of these things and I'm afraid neither of them make a difference.
-
thoughton about 14 yearsthanks for the update. The situation in that thread does indeed sound eerily similar. I have tried playing around with the debugger source paths a little to try to fix the problem, but I can't remember if I specifically tried "filesystem" paths. I will have another try tonight when I'm back at that computer.
-
mlvljr almost 12 yearsJust for the record, with todays (may 2012) Indigo, setting "use full file path to set breakpoints" actually helps when everything is built and linked correctly (and works perfectly under command-line gdb), BUT ECLIPSE DEBUGGER STILL SAYS "No source available for main" (btw, that was a bug bugs.eclipse.org/bugs/show_bug.cgi?id=305285 -- which is currently closed).
-
Paul Chernoch over 10 yearsThanks. This solved my problem. I was using a supplied Makefile and it didn't have the -g option set. I am spoiled after using Visual Studio! Then after I changed the makefile, I had to touch the source files so they would recompile. The Makefile itself was not listed as a dependency for compile lines in the makefile.
-
 Aaron Campbell almost 9 yearsWhat is the "Debug Dialog" mentioned in the quoted paragraph? How do I get to the "add filesystem path" option?
 -
 VonC almost 9 years@AaronCampbell 5+ years later, I am not sure, but I suspect this was with Eclise + CDT (the plugin for C/C++ development with Eclipse)
 -
 Aaron Campbell almost 9 yearsHaha, ok. I didn't find a dialog, but I did find these options in the "Debug Configurations" window.
 -
Patricio Rossi over 7 yearsSame here Mars running on linux x86_64 box, as soon as I changed g3 to g I got output.
-
val is still with Monica over 5 yearsJust replace
-O3with-O1, it just overrides it. -
 ThePhi over 3 yearsEclipse 2020-03, this option doesn't exist anymore apparently.
 -
 Admin over 3 years@ThePhi: The option exists only if you have the right toolchain configured. I am no Eclipse expert but with a managed project, I have the options and when using my own makefile, the options are not there.

![[SOLVED] HOW TO SOLVE SOURCE FILE NOT COMPLETED ERROR IN DEV C ++ With English Sub Titles](https://i.ytimg.com/vi/g3LVmxvyVJg/hq720.jpg?sqp=-oaymwEcCNAFEJQDSFXyq4qpAw4IARUAAIhCGAFwAcABBg==&rs=AOn4CLCCwPOGpflLoxP2rUO3_8mNJPtnXQ)


