ggplot2 - line plot by year-quarter on the x axis
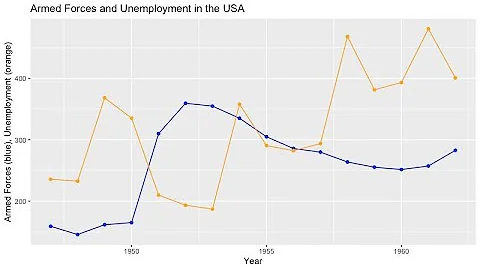
Is this what you're looking for?
myplot <- ggplot(data = df, aes(x=yearqtr, y=assets, group=1)) +
  geom_line()
myplot <- myplot +
  theme(panel.grid.major = element_blank(),
        panel.grid.minor = element_blank(),
        panel.background = element_blank(),
        axis.line = element_line(colour = "black")) +
  scale_y_continuous(labels = comma) +
  theme(axis.text.x=element_text(angle=-45, hjust=0.001))
myplot

Related videos on Youtube
 14 : 27
 07 : 03
 22 : 28
 13 : 25
 13 : 28
 05 : 29
 04 : 02
 04 : 09
 04 : 29
rajvijay
Updated on June 26, 2022Comments
-
rajvijay almost 2 years
I am trying to use ggplot2 for the following. I am looking for line chart, but running in to issues. I have two related questions.
1.)
 df = read.table(text = "bank  filer    id  quarter year    loan    assets
 year qtr yearqtr code assets
 2001 1   2001-1    51       39007.16
 2001 2   2001-2    51       83337.32
 2001 3   2001-3    51      133618.83
 2001 4   2001-4    51      211263.55
 2002 1   2002-1    51       68034.41
 2002 3   2002-2    51      134005.24
 2002 3   2002-3    51      203544.39
 2002 4   2002-4    51      274482.43
 2003 1   2003-1    51       63188.83"
, sep ="", header = TRUE)
First I am looking to plot assets by yearqtr -- yearqtr formed by concatenate
year and qtr.To plot by quarter I have the following code:
 myplot <- ggplot(data = df, aes(x=yearqtr, y=assets))  + geom_line()

 myplot <- myplot + theme(panel.grid.major = element_blank(), panel.grid.minor =         element_blank(),  panel.background = element_blank(), axis.line = element_line(colour = "black"))
But I get
geom_path: Each group consist of only one observation. Do you need to adjust the group aesthetic?I wonder if it is due to that yearqtr is not number? What would be the issue?
My question 2.) is how do we show that how do I plot the quarter values of the asset, but then on the x-axis just show 2000, 2001, 2002, ... This is because since I have 2001-1, 2001-2, ... , 2014-1. The x-axis looks very crowded, so I am trying to see if I can display something like
2000 2001 2003 and then have the quarter values displayed in between them.
Thank you so much. appreciate any advice.