How can I read pcap files in a friendly format?
Solution 1
Wireshark is probably the best, but if you want/need to look at the payload without loading up a GUI you can use the -X or -A options
tcpdump -qns 0 -X -r serverfault_request.pcap
14:28:33.800865 IP 10.2.4.243.41997 > 69.59.196.212.80: tcp 1097
        0x0000:  4500 047d b9c4 4000 4006 63b2 0a02 04f3  E..}..@[email protected].....
        0x0010:  453b c4d4 a40d 0050 f0d4 4747 f847 3ad5  E;.....P..GG.G:.
        0x0020:  8018 f8e0 1d74 0000 0101 080a 0425 4e6d  .....t.......%Nm
        0x0030:  0382 68a1 4745 5420 2f71 7565 7374 696f  ..h.GET./questio
        0x0040:  6e73 2048 5454 502f 312e 310d 0a48 6f73  ns.HTTP/1.1..Hos
        0x0050:  743a 2073 6572 7665 7266 6175 6c74 2e63  t:.serverfault.c
        0x0060:  6f6d 0d0a 5573 6572 2d41 6765 6e74 3a20  om..User-Agent:.
        0x0070:  4d6f 7a69 6c6c 612f 352e 3020 2858 3131  Mozilla/5.0.(X11
        0x0080:  3b20 553b 204c 696e 7578 2069 3638 363b  ;.U;.Linux.i686;
tcpdump -qns 0 -A -r serverfault_request.pcap
14:29:33.256929 IP 10.2.4.243.41997 > 69.59.196.212.80: tcp 1097
E..}..@[email protected].
...E;...^M.P..^w.G.......t.....
.%.}..l.GET /questions HTTP/1.1
Host: serverfault.com
There are many other tools for reading and getting stats, extracting payloads and so on. A quick look on the number of things that depend on libpcap in the debian package repository gives a list of 50+ tools that can be used to slice, dice, view, and manipulate captures in various ways.
For example.
Solution 2
You may never look back :)
Incidentally you should make sure the snaplen of your original capture matches or exceeds the MTU of the traffic that you're capturing. Otherwise the contents will appear truncated.
Solution 3
tshark -r file.pcap -V is very useful if you're stuck without wireshark/gui.
Solution 4
You can use wireshark which is a gui app or you can use tshark which is it's cli counterpart.
Besides, you can visualize the pcap using several visualization tools:
- tnv - The Network Visualizer or Time-based Network Visualizer
- afterglow - A collection of scripts which facilitate the process of generating graphs
- INAV - Interactive Network Active-traffic Visualization
If you want to analyze the pcap file you can use the excelent nsm-console.
Last, but not least, you can upload your pcap to pcapr.net and watch it there. pcapr.net is a kind of social website to analyze and comment to traffic captures.
Solution 5
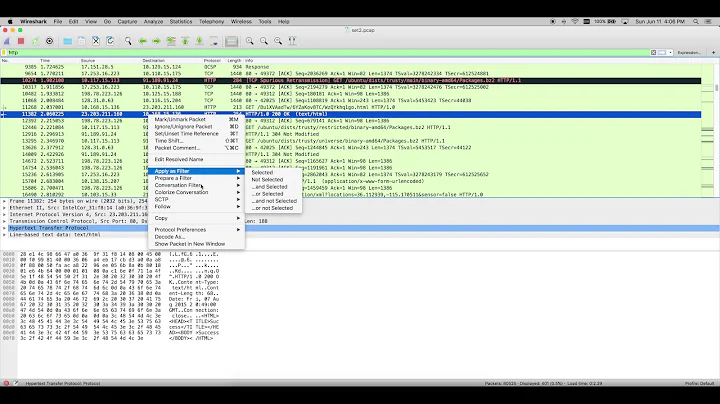
You can simply load pcap files in Wireshark to browse them.
Related videos on Youtube
 09 : 25
 05 : 00
 05 : 00
 04 : 19
 17 : 29
Tony
Updated on September 17, 2022Comments
-
Tony over 1 year
a simple cat on the pcap file looks terrible:
$cat tcp_dump.pcap

?ò????YVJ?
          JJ
            ?@@.?E<??@@
?CA??qe?U????иh?
.Ceh?YVJ??
          JJ
            ?@@.?E<??@@
CA??qe?U????еz?
.ChV?YVJ$?JJ
            ?@@.?E<-/@@A?CAͼ?9????F???A&?
.Ck??YVJgeJJ@@.?Ӣ#3E<@3{nͼ?9CA??P?ɝ?F???<K?
?ԛ`.Ck??YVJgeBB
               ?@@.?E4-0@@AFCAͼ?9????F?P?ʀ???
.Ck??ԛ`?YVJ?""@@.?Ӣ#3E?L@3?Iͼ?9CA??P?ʝ?F?????
?ԛ?.Ck?220-rly-da03.mx
etc.
I tried to make it prettier with:
sudo tcpdump -ttttnnr tcp_dump.pcap
reading from file tcp_dump.pcap, link-type EN10MB (Ethernet)
2009-07-09 20:57:40.819734 IP 67.23.28.65.49237 > 216.239.113.101.25: S 2535121895:2535121895(0) win 5840 <mss 1460,sackOK,timestamp 776168808 0,nop,wscale 5>
2009-07-09 20:57:43.819905 IP 67.23.28.65.49237 > 216.239.113.101.25: S 2535121895:2535121895(0) win 5840 <mss 1460,sackOK,timestamp 776169558 0,nop,wscale 5>
2009-07-09 20:57:47.248100 IP 67.23.28.65.42385 > 205.188.159.57.25: S 2644526720:2644526720(0) win 5840 <mss 1460,sackOK,timestamp 776170415 0,nop,wscale 5>
2009-07-09 20:57:47.288103 IP 205.188.159.57.25 > 67.23.28.65.42385: S 1358829769:1358829769(0) ack 2644526721 win 5792 <mss 1460,sackOK,timestamp 4292123488 776170415,nop,wscale 2>
2009-07-09 20:57:47.288103 IP 67.23.28.65.42385 > 205.188.159.57.25: . ack 1 win 183 <nop,nop,timestamp 776170425 4292123488>
2009-07-09 20:57:47.368107 IP 205.188.159.57.25 > 67.23.28.65.42385: P 1:481(480) ack 1 win 1448 <nop,nop,timestamp 4292123568 776170425>
2009-07-09 20:57:47.368107 IP 67.23.28.65.42385 > 205.188.159.57.25: . ack 481 win 216 <nop,nop,timestamp 776170445 4292123568>
2009-07-09 20:57:47.368107 IP 67.23.28.65.42385 > 205.188.159.57.25: P 1:18(17) ack 481 win 216 <nop,nop,timestamp 776170445 4292123568>
2009-07-09 20:57:47.404109 IP 205.188.159.57.25 > 67.23.28.65.42385: . ack 18 win 1448 <nop,nop,timestamp 4292123606 776170445>
2009-07-09 20:57:47.404109 IP 205.188.159.57.25 > 67.23.28.65.42385: P 481:536(55) ack 18 win 1448 <nop,nop,timestamp 4292123606 776170445>
2009-07-09 20:57:47.404109 IP 67.23.28.65.42385 > 205.188.159.57.25: P 18:44(26) ack 536 win 216 <nop,nop,timestamp 776170454 4292123606>
2009-07-09 20:57:47.444112 IP 205.188.159.57.25 > 67.23.28.65.42385: P 536:581(45) ack 44 win 1448 <nop,nop,timestamp 4292123644 776170454>
2009-07-09 20:57:47.484114 IP 67.23.28.65.42385 > 205.188.159.57.25: . ack 581 win 216 <nop,nop,timestamp 776170474 4292123644>
2009-07-09 20:57:47.616121 IP 67.23.28.65.42385 > 205.188.159.57.25: P 44:50(6) ack 581 win 216 <nop,nop,timestamp 776170507 4292123644>
2009-07-09 20:57:47.652123 IP 205.188.159.57.25 > 67.23.28.65.42385: P 581:589(8) ack 50 win 1448 <nop,nop,timestamp 4292123855 776170507>
2009-07-09 20:57:47.652123 IP 67.23.28.65.42385 > 205.188.159.57.25: . ack 589 win 216 <nop,nop,timestamp 776170516 4292123855>
2009-07-09 20:57:47.652123 IP 67.23.28.65.42385 > 205.188.159.57.25: P 50:56(6) ack 589 win 216 <nop,nop,timestamp 776170516 4292123855>
2009-07-09 20:57:47.652123 IP 67.23.28.65.42385 > 205.188.159.57.25: F 56:56(0) ack 589 win 216 <nop,nop,timestamp 776170516 4292123855>
2009-07-09 20:57:47.668124 IP 67.23.28.65.49239 > 216.239.113.101.25: S 2642380481:2642380481(0) win 5840 <mss 1460,sackOK,timestamp 776170520 0,nop,wscale 5>
2009-07-09 20:57:47.692126 IP 205.188.159.57.25 > 67.23.28.65.42385: P 589:618(29) ack 57 win 1448 <nop,nop,timestamp 4292123893 776170516>
2009-07-09 20:57:47.692126 IP 67.23.28.65.42385 > 205.188.159.57.25: R 2644526777:2644526777(0) win 0
2009-07-09 20:57:47.692126 IP 205.188.159.57.25 > 67.23.28.65.42385: F 618:618(0) ack 57 win 1448 <nop,nop,timestamp 4292123893 776170516>
2009-07-09 20:57:47.692126 IP 67.23.28.65.42385 > 205.188.159.57.25: R 2644526777:2644526777(0) win 0
Well...that is much prettier but it doesn't show the actual messages. I can actually extract more information just viewing the RAW file. What is the best ( and preferably easiest) way to just view all the contents of the pcap file?
UPDATE
Thanks to the responses below, I made some progress. Here is what it looks like now:
tcpdump -qns 0 -A -r blah.pcap
    20:57:47.368107 IP 205.188.159.57.25 > 67.23.28.65.42385: tcp 480
        0x0000:  4500 0214 834c 4000 3306 f649 cdbc 9f39  [email protected]
        0x0010:  4317 1c41 0019 a591 50fe 18ca 9da0 4681  C..A....P.....F.
        0x0020:  8018 05a8 848f 0000 0101 080a ffd4 9bb0  ................
        0x0030:  2e43 6bb9 3232 302d 726c 792d 6461 3033  .Ck.220-rly-da03
        0x0040:  2e6d 782e 616f 6c2e 636f 6d20 4553 4d54  .mx.aol.com.ESMT
        0x0050:  5020 6d61 696c 5f72 656c 6179 5f69 6e2d  P.mail_relay_in-
        0x0060:  6461 3033 2e34 3b20 5468 752c 2030 3920  da03.4;.Thu,.09.
        0x0070:  4a75 6c20 3230 3039 2031 363a 3537 3a34  Jul.2009.16:57:4
        0x0080:  3720 2d30 3430 300d 0a32 3230 2d41 6d65  7.-0400..220-Ame
        0x0090:  7269 6361 204f 6e6c 696e 6520 2841 4f4c  rica.Online.(AOL
        0x00a0:  2920 616e 6420 6974 7320 6166 6669 6c69  ).and.its.affili
        0x00b0:  6174 6564 2063 6f6d 7061 6e69 6573 2064  ated.companies.d
etc.
This looks good, but it still makes the actual message on the right difficult to read. Is there a way to view those messages in a more friendly way?
UPDATE
This made it pretty:
tcpick -C -yP -r tcp_dump.pcapThanks!
-
Yaakov Kuperman over 10 yearsI was able to extract a readable email from pcap data using 'strings'
-
-
user1124702 almost 15 yearsAlso you may want to use -w to do a binary dump and -s 200 to lengthen the packet snapshot (if you are looking at name server or nfs packets).
-
Dan Carley almost 15 yearsUpvoted. It can make for messy reading, but useful for those in-the-field scenarios. Which reminds me - ngrep!
-
Tony almost 15 yearsthe tcpdump commands you gave are better but i am still not really getting what i want. i updated my question to reflect that. the wireshark installation didn't work and i don't want to install it unless i have to. thanks for your help so far and let me know if you have any other suggestions.
-
Tony almost 15 yearsok, this command seemed to do it with tcpick. it would probably benefit others it you added it to your answer "tcpick -C -yP -r tcp_dump.pcap"
-
 Admin almost 15 yearsprovidercorga - you could add it to your answer instead of someone else going to the effort, and you might get points too. just sayin'.
 -
Tony almost 15 yearsok, il do that. just wanted to try and give Zoredache credit since he gave a great answer
-
 Goaler444 about 11 yearsI am getting permission denied when I try this command, even if I use sudo. Any ideas how I can solve this?
 -
User over 6 yearsWireshark is great - but not ideal when working with limit resources on a VM.
-
 John D over 5 years
tcpdump -qns 0 -A -r file.pcapis rlly useful in CTFs :smirk: