How to base seaborn boxplot whiskers on percentiles?
Seaborn seems to work the same as matplotlib in this regard:
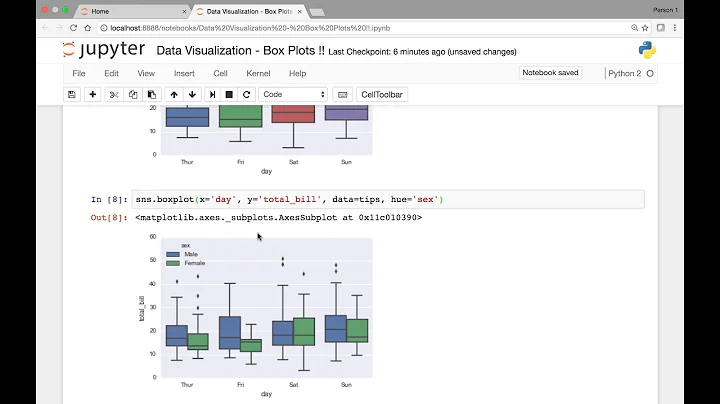
tips = sns.load_dataset("tips")
ax = sns.boxplot(x=tips["total_bill"], whis=[5, 95])
plt.grid(True)

plt.boxplot(tips["total_bill"], whis=[5, 95], vert=False)
plt.grid(True)

I guess seaborn just pass whis to the matplotlib method. The docstring might have been copied from an earlier version of matplotlib.
Related videos on Youtube
 13 : 56
 08 : 24
 04 : 01
 07 : 48
 15 : 16
 06 : 35
 11 : 07
 13 : 10
 11 : 13
Hauzero
Updated on September 17, 2022Comments
-
Hauzero over 1 year
I am using a boxplot to show differences in the distribution of values between groups. The lower(25) and higher (75) percentiles and the median are indicative of the distribution and main differences between groups. The whiskers are however less clear. By default in matlibplot or seaborn, the whiskers of a boxplot are a representation of a multiple (default: 1.5) of the innerquartile range (IQR), which is the range of values covered by the inner box. Points outside this range will be identified as outliers. Both seaborn and matlibplot have the same command to change the location of the whiskers:
whis : float,
Proportion of the IQR past the low and high quartiles to extend the plot whiskers.Points outside this range will be identified as outliers.
For example:
boxplots = ax.boxplot(myData, whis=1.5)Alternatively, matlibplot also allows to base the whiskers on percentiles. This works better for the story I am trying to tell with my data. For example:
boxplots = ax.boxplot(myData, whis=[5, 95])In contrast to matlibplot, the
whis=[5, 95]does not work in Seaborn. Now I am looking for way to define the whiskers in Seaborn based on percentiles.My first idea was to get the values of the whiskers from matlibplot based on percentiles and find the corresponding proportional IQR whisker value. This is what I did:
for w in np.arange(0.00,2.00, 0.01):
        fig, ax = plt.subplots(ncols=2, nrows=1,figsize=(8, 6))
        bp = ax[0].boxplot(myData, whis=[5, 95])
        ax[0].set_xlabel('bp')
        ap = ax[1].boxplot(myData, whis=w)
        ax[1].set_xlabel('ap')

        r = 3

        alo =  (np.round(bp['whiskers'][0].get_ydata(), r))
        blo =  (np.round(ap['whiskers'][0].get_ydata(), r))
        ahi =  (np.round(bp['whiskers'][1].get_ydata(), r))
        bhi =  (np.round(ap['whiskers'][1].get_ydata(), r))

        plt.close()

        if [alo == blo] == [True, True]:
            if [ahi == bhi] == [True, True]:
                print w, "|", alo[1], "=", blo[1], '&', ahi[1], "=", bhi[1]
The problem however is that this only works for perfectly normal distribution which my data does not meet. So I would really like find a way to use percentiles for the whiskers in Seaborn boxplots. Is there any way to do this?
-
Hauzero almost 6 yearsThanks a lot for trying it for me! At first, I tried the whis = [5, 95] in Seaborn and it did not work for me. The fact that it worked for you triggered me to update my anaconda since I might have been running older packages. And after that Seaborn's boxplot whisker based on percentiles worked for me too.