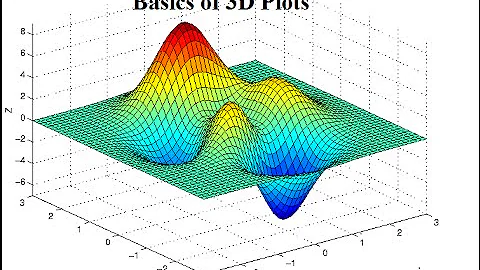
How to plot a 3d surface graph in MATLAB?
21,201
Solution 1
surf(X,Y,Z)

Solution 2
May a bar plot yield the desired picture?
Y = [0.1 0.2 0.3 0.4];
X = [1 2 3 4];
Z = [10 11 12 13; 11 12 13 14; 12 13 14 15; 13 14 15 16];

figure;
bar3(Z)
set(gca(gcf), 'xticklabel',{'0.1','0.2','0.3','0.4'})

Related videos on Youtube
 06 : 13
3D Plots in Matlab For Beginners
 34 : 58
3D Plotting in Matlab
 02 : 12
MATLAB 3D Surface Plots
 09 : 10
Matlab for Non Believers - 3D Surface Plots
 04 : 42
How to 3D Plot in Matlab with Example
 22 : 19
3-D plot, Surface Plot and Color Map using MATLAB Live Editor
 11 : 51
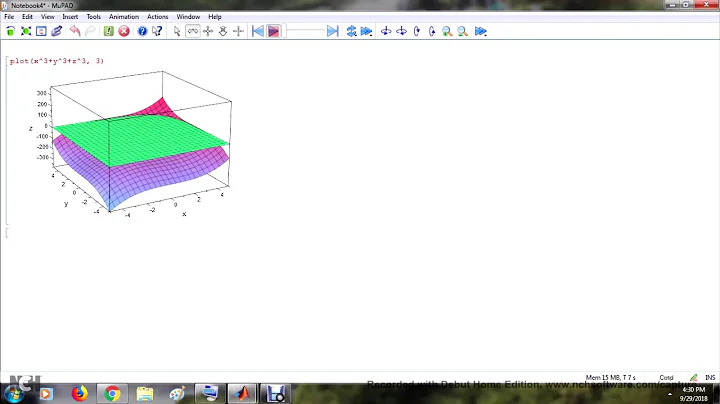
Plotting Multivariate Equations In MATLAB. 3D Surface Plot Using MATLAB
 13 : 24
How to generate 3D plot in MATLAB - Part 1 | 3D plot in Matlab for beginner | MATLAB TUTORIALS
Author by
Admin
Updated on April 11, 2020Comments
-
 Admin about 4 years
I have a dataset like so:
  | 0.1  0.2  0.3  0.4
----------------------
1 | 10   11   12   13
2 | 11   12   13   14
3 | 12   13   14   15
4 | 13   14   15   16
I want to plot a 3D surface graph in matlab such that the column headings will be on the y axis, the row headings will be on the x axis and the remaining values will determine the height of the point on the z axis.
I have had a look around at lots of different example and I can't work out how to achieve this. At the moment I have got the following:
Y = [0.1 0.2 0.3 0.4];
X = [1 2 3 4];
Z = [10 11 12 13; 11 12 13 14; 12 13 14 15; 13 14 15 16];
Please could someone help me out?