Linux - How can I see what's waiting for disk IO
Solution 1
You can use an I/O monitor like iotop, but it will show you only processes or threads with current I/O operations.
If you need to browse processes waiting for I/O, use watch to monitor processes with STAT flag 'D' like below:
watch -n 1 "(ps aux | awk '\$8 ~ /D/ { print \$0 }')"
Solution 2
ps axu and look for processes which are in the "D" state. Based on the ps(1) manpage, processes that are in the D state are in uninterruptable sleep, which almost always means 'waiting for IO'. Unfortunately, killing these processes is usually not possible.
Solution 3
Zanchey's answer is the best I know to find out what is waiting for IO.
When you say your server is under high load, what do you mean by that? Something in particular is slow to respond?
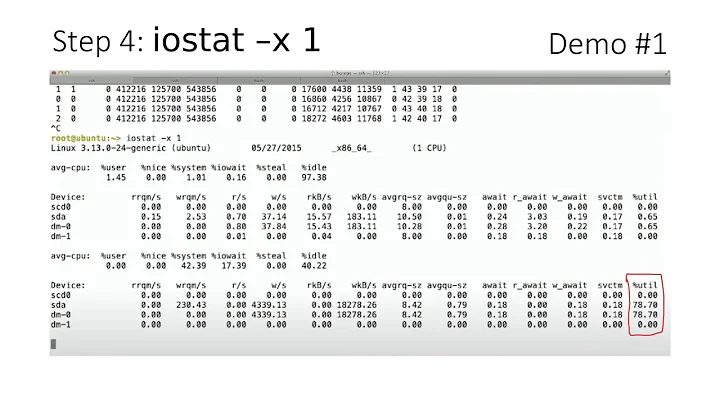
If you are wondering if your Disk IO is the bottleneck, I would use the iostat command (part of the sysstat package) to see if the disk actually is under heavy load.
Example:
[kbrandt@kbrandt-opadmin: ~] iostat -x 1 3

avg-cpu:  %user   %nice %system %iowait  %steal   %idle
           2.38   34.71    2.64    1.18    0.00   59.21
Device:         rrqm/s   wrqm/s     r/s     w/s   rsec/s   wsec/s avgrq-sz avgqu-sz   await  svctm  %util
sda               0.11    17.35    2.21   20.31    46.57   301.40    15.45     2.27  100.66   1.48   3.34
sda1              0.10    17.31    2.21   20.31    46.48   301.10    15.44     2.27  100.66   1.48   3.34
sda2              0.00     0.00    0.00    0.00     0.00     0.00     3.50     0.00   30.00  30.00   0.00
sr0               0.00     0.00    0.00    0.00     0.00     0.00    18.44     0.00  677.67 512.61   0.00

avg-cpu:  %user   %nice %system %iowait  %steal   %idle
           6.22    0.00    4.31    0.00    0.00   89.47
Device:         rrqm/s   wrqm/s     r/s     w/s   rsec/s   wsec/s avgrq-sz avgqu-sz   await  svctm  %util
sda               0.00     0.00    0.00    0.00     0.00     0.00     0.00     0.00    0.00   0.00   0.00
sda1              0.00     0.00    0.00    0.00     0.00     0.00     0.00     0.00    0.00   0.00   0.00
sda2              0.00     0.00    0.00    0.00     0.00     0.00     0.00     0.00    0.00   0.00   0.00
sr0               0.00     0.00    0.00    0.00     0.00     0.00     0.00     0.00    0.00   0.00   0.00
Solution 4
Enable block_dump logging of what processes are doing block read/write operations:
echo 1 > /proc/sys/vm/block_dump
tail -f /var/log/syslog
when done, disable the tracing so you don't spam your log files:
echo 0 > /proc/sys/vm/block_dump
Related videos on Youtube
 07 : 14
 10 : 51
 17 : 26
 04 : 28
 05 : 02
Araejay
Updated on September 18, 2022Comments
-
Araejay over 1 year
I have a server that has a really high load. Nothing is jumping out at me in terms of CPU usage, and it's not swapping.
I think it's cause some processes are waiting for disk IO, and I want to see what's waiting.
Is there any programme that'll show me what processes are waiting for IO? I know about
iotopbut that shows what's currently doing IO.Or is this a silly question? (If so explain how :) )
-
Mike Broughton over 12 yearsSweet. This helped me out nicely.
-
 Ryan about 7 yearsAlternatively, You can use the 'iotop -o' command which will only show 'processes or threads actually doing I/O' as per the iotop --help.
 -
Rich over 6 years@Ryan Aside from it not supplying the requisite
iowaitinformation,iotoprequires elevated privileges.watch,ps, andawkgive only the requisite information, and do not require elevated privileges. -
Rich over 6 yearsI would have used
ps's POSIX flags andawked it out differently:watch "(ps -eo stat,pid,comm|awk '(NR==1)||(\$1~/D/){print}')"-- this way you get the column headings, and the stat, pid, and command. -
 Scott Buchanan over 5 yearsIt would be helpful to explain how to interpret the output of iostat "to see if the disk actually under heavy load."