Plotting heatmap for 3 columns in python with seaborn
Solution 1
A seaborn heatmap plots categorical data. This means that each occuring value would take the same space in the heatmap as any other value, independent on how far they are separated numerically. This is usually undesired for numerical data. Instead one of the following techniques may be chosen.
Scatter
A colored scatter plot may be just as good as a heatmap. The colors of the points would represent the yy value.
ax.scatter(df.v1, df.v2, c=df.yy, cmap="copper")

u = u"""v1      v2      yy
15.25   44.34   100.00
83.05   59.78   100.00
96.61   65.09   100.00
100.00  75.47   100.00
100.00  50.00   100.00
100.00  68.87   100.00
100.00  79.35   100.00
100.00  100.00  100.00
100.00  63.21   100.00
100.00  100.00  100.00
100.00  68.87   100.00
0.00    56.52   92.86
10.17   52.83   92.86
23.73   46.23   92.86"""

import pandas as pd
import matplotlib.pyplot as plt
import io

df = pd.read_csv(io.StringIO(u), delim_whitespace=True )

fig, ax = plt.subplots()

sc = ax.scatter(df.v1, df.v2, c=df.yy,  cmap="copper")

fig.colorbar(sc, ax=ax)

ax.set_aspect("equal")


plt.show()
Hexbin
You may want to look into hexbin. The data would be shown in hexagonal bins and the data is aggregated as the mean inside each bin. The advantage here is that if you choose the gridsize large, it will look like a scatter plot, while if you make it small, it looks like a heatmap, allowing to adjust the plot easily to the desired resolution.
h1 = ax.hexbin(df.v1, df.v2, C=df.yy, gridsize=100, cmap="copper")
h2 = ax2.hexbin(df.v1, df.v2, C=df.yy, gridsize=10, cmap="copper")

u = u"""v1      v2      yy
15.25   44.34   100.00
83.05   59.78   100.00
96.61   65.09   100.00
100.00  75.47   100.00
100.00  50.00   100.00
100.00  68.87   100.00
100.00  79.35   100.00
100.00  100.00  100.00
100.00  63.21   100.00
100.00  100.00  100.00
100.00  68.87   100.00
0.00    56.52   92.86
10.17   52.83   92.86
23.73   46.23   92.86"""

import pandas as pd
import matplotlib.pyplot as plt
import io

df = pd.read_csv(io.StringIO(u), delim_whitespace=True )

fig, (ax, ax2) = plt.subplots(nrows=2)

h1 = ax.hexbin(df.v1, df.v2, C=df.yy, gridsize=100, cmap="copper")
h2 = ax2.hexbin(df.v1, df.v2, C=df.yy, gridsize=10, cmap="copper")

fig.colorbar(h1, ax=ax)
fig.colorbar(h2, ax=ax2)
ax.set_aspect("equal")
ax2.set_aspect("equal")
ax.set_title("gridsize=100")
ax2.set_title("gridsize=10")
fig.subplots_adjust(hspace=0.3)
plt.show()
Tripcolor
A tripcolor plot can be used to obtain colored reagions in the plot according to the datapoints, which are then interpreted as the edges of triangles, colorized according the edgepoints' data. Such a plot would require to have more data available to give a meaningful representation.
ax.tripcolor(df.v1, df.v2, df.yy, cmap="copper")

u = u"""v1      v2      yy
15.25   44.34   100.00
83.05   59.78   100.00
96.61   65.09   100.00
100.00  75.47   100.00
100.00  50.00   100.00
100.00  68.87   100.00
100.00  79.35   100.00
100.00  100.00  100.00
100.00  63.21   100.00
100.00  100.00  100.00
100.00  68.87   100.00
0.00    56.52   92.86
10.17   52.83   92.86
23.73   46.23   92.86"""

import pandas as pd
import matplotlib.pyplot as plt
import io

df = pd.read_csv(io.StringIO(u), delim_whitespace=True )

fig, ax = plt.subplots()

tc = ax.tripcolor(df.v1, df.v2, df.yy,  cmap="copper")

fig.colorbar(tc, ax=ax)

ax.set_aspect("equal")
ax.set_title("tripcolor")

plt.show()
Note that atricontourf plot may equally be suited, if more datapoints throughout the grid are available.
ax.tricontourf(df.v1, df.v2, df.yy, cmap="copper")
Solution 2
The problem that your data has duplicate values like:
100.00  100.00  100.00
100.00  100.00  100.00
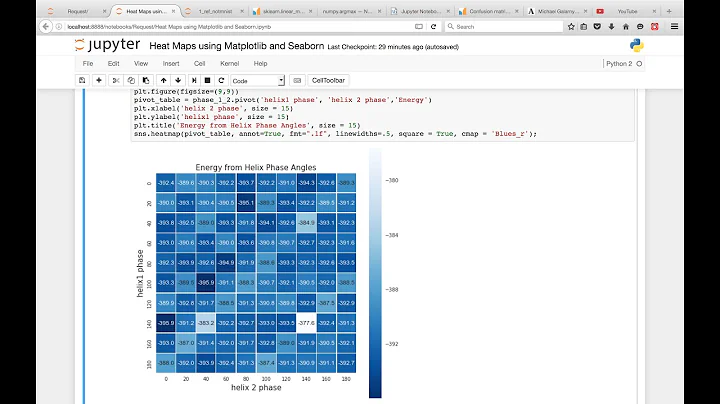
You have to drop duplicate values then pivot and plot like here:
import seaborn as sns
import pandas as pd

# fill data

df = pd.read_clipboard()
df.drop_duplicates(['v1','v2'], inplace=True)
pivot = df.pivot(index='v1', columns='v2', values='yy')
ax = sns.heatmap(pivot,annot=True)
plt.show()

print (pivot)

Pivot:
v2      44.34   46.23   50.00   52.83   56.52   59.78   63.21   65.09   \
v1
0.00       NaN     NaN     NaN     NaN   92.86     NaN     NaN     NaN
10.17      NaN     NaN     NaN   92.86     NaN     NaN     NaN     NaN
15.25    100.0     NaN     NaN     NaN     NaN     NaN     NaN     NaN
23.73      NaN   92.86     NaN     NaN     NaN     NaN     NaN     NaN
83.05      NaN     NaN     NaN     NaN     NaN   100.0     NaN     NaN
96.61      NaN     NaN     NaN     NaN     NaN     NaN     NaN   100.0
100.00     NaN     NaN   100.0     NaN     NaN     NaN   100.0     NaN

v2      68.87   75.47   79.35   100.00
v1
0.00       NaN     NaN     NaN     NaN
10.17      NaN     NaN     NaN     NaN
15.25      NaN     NaN     NaN     NaN
23.73      NaN     NaN     NaN     NaN
83.05      NaN     NaN     NaN     NaN
96.61      NaN     NaN     NaN     NaN
100.00   100.0   100.0   100.0   100.0
Related videos on Youtube
 12 : 30
 07 : 56
 11 : 27
 07 : 37
 13 : 03
 01 : 13 : 40
 01 : 28
user308827
Updated on July 07, 2022Comments
-
user308827 almost 2 years
v1      v2      yy
15.25   44.34   100.00
83.05   59.78   100.00
96.61   65.09   100.00
100.00  75.47   100.00
100.00  50.00   100.00
100.00  68.87   100.00
100.00  79.35   100.00
100.00  100.00  100.00
100.00  63.21   100.00
100.00  100.00  100.00
100.00  68.87   100.00
0.00    56.52   92.86
10.17   52.83   92.86
23.73   46.23   92.86
In the dataframe above, I want to plot a heatmap using v1 and v2 as x and y axis and yy as the value. How can I do that in python? I tried seaborn:
df = df.pivot('v1', 'v2', 'yy')
ax = sns.heatmap(df)
However, this does not work. Any other solution?
-
GWW almost 7 yearsPerhaps you are looking for something like this
-