Still Reachable Leak detected by Valgrind
Solution 1
There is more than one way to define "memory leak". In particular, there are two primary definitions of "memory leak" that are in common usage among programmers.
The first commonly used definition of "memory leak" is, "Memory was allocated and was not subsequently freed before the program terminated." However, many programmers (rightly) argue that certain types of memory leaks that fit this definition don't actually pose any sort of problem, and therefore should not be considered true "memory leaks".
An arguably stricter (and more useful) definition of "memory leak" is, "Memory was allocated and cannot be subsequently freed because the program no longer has any pointers to the allocated memory block." In other words, you cannot free memory that you no longer have any pointers to. Such memory is therefore a "memory leak". Valgrind uses this stricter definition of the term "memory leak". This is the type of leak which can potentially cause significant heap depletion, especially for long lived processes.
The "still reachable" category within Valgrind's leak report refers to allocations that fit only the first definition of "memory leak". These blocks were not freed, but they could have been freed (if the programmer had wanted to) because the program still was keeping track of pointers to those memory blocks.
In general, there is no need to worry about "still reachable" blocks. They don't pose the sort of problem that true memory leaks can cause. For instance, there is normally no potential for heap exhaustion from "still reachable" blocks. This is because these blocks are usually one-time allocations, references to which are kept throughout the duration of the process's lifetime. While you could go through and ensure that your program frees all allocated memory, there is usually no practical benefit from doing so since the operating system will reclaim all of the process's memory after the process terminates, anyway. Contrast this with true memory leaks which, if left unfixed, could cause a process to run out of memory if left running long enough, or will simply cause a process to consume far more memory than is necessary.
Probably the only time it is useful to ensure that all allocations have matching "frees" is if your leak detection tools cannot tell which blocks are "still reachable" (but Valgrind can do this) or if your operating system doesn't reclaim all of a terminating process's memory (all platforms which Valgrind has been ported to do this).
Solution 2
Since there is some routine from the the pthread family on the bottom (but I don't know that particular one), my guess would be that you have launched some thread as joinable that has terminated execution.
The exit state information of that thread is kept available until you call pthread_join. Thus, the memory is kept in a loss record at program termination, but it is still reachable since you could use pthread_join to access it.
If this analysis is correct, either launch these threads detached, or join them before terminating your program.
Edit: I ran your sample program (after some obvious corrections) and I don't have errors but the following
==18933== ERROR SUMMARY: 0 errors from 0 contexts (suppressed: 4 from 4)
--18933--
--18933-- used_suppression:      2 dl-hack3-cond-1
--18933-- used_suppression:      2 glibc-2.5.x-on-SUSE-10.2-(PPC)-2a
Since the dl- thing resembles much of what you see I guess that you see a known problem that has a solution in terms of a suppression file for valgrind. Perhaps your system is not up to date, or your distribution doesn't maintain these things. (Mine is ubuntu 10.4, 64bit)
Solution 3
Here is a proper explanation of "still reachable":
"Still reachable" are leaks assigned to global and static-local variables. Because valgrind tracks global and static variables it can exclude memory allocations that are assigned "once-and-forget". A global variable assigned an allocation once and never reassigned that allocation is typically not a "leak" in the sense that it does not grow indefinitely. It is still a leak in the strict sense, but can usually be ignored unless you are pedantic.
Local variables that are assigned allocations and not free'd are almost always leaks.
Here is an example
int foo(void)
{
    static char *working_buf = NULL;
    char *temp_buf;
    if (!working_buf) {
         working_buf = (char *) malloc(16 * 1024);
    }
    temp_buf = (char *) malloc(5 * 1024);
    ....
    ....
    ....
}
Valgrind will report working_buf as "still reachable - 16k" and temp_buf as "definitely lost - 5k".
Solution 4
You don't appear to understand what still reachable means.
Anything still reachable is not a leak. You don't need to do anything about it.
Related videos on Youtube
 17 : 51
 11 : 12
 13 : 25
 07 : 39
Admin
Updated on January 18, 2020Comments
-
 Admin almost 3 years
All the functions mentioned in this block are library functions. How can I rectify this memory leak?
It is listed under the "Still reachable" category. (There are 4 more, which are very similar, but of varying sizes)
 630 bytes in 1 blocks are still reachable in loss record 5 of 5
    at 0x4004F1B: calloc (vg_replace_malloc.c:418)
    by 0x931CD2: _dl_new_object (dl-object.c:52)
    by 0x92DD36: _dl_map_object_from_fd (dl-load.c:972)
    by 0x92EFB6: _dl_map_object (dl-load.c:2251)
    by 0x939F1B: dl_open_worker (dl-open.c:255)
    by 0x935965: _dl_catch_error (dl-error.c:178)
    by 0x9399C5: _dl_open (dl-open.c:584)
    by 0xA64E31: do_dlopen (dl-libc.c:86)
    by 0x935965: _dl_catch_error (dl-error.c:178)
    by 0xA64FF4: __libc_dlopen_mode (dl-libc.c:47)
    by 0xAE6086: pthread_cancel_init (unwind-forcedunwind.c:53)
    by 0xAE61FC: _Unwind_ForcedUnwind (unwind-forcedunwind.c:126)
Catch: Once I ran my program, it gave no memory leaks, but it had one additional line in the Valgrind output, which wasn't present before:
Discarding syms at 0x5296fa0-0x52af438 in /lib/libgcc_s-4.4.4-20100630.so.1 due to munmap()
If the leak can't be rectified, can someone atleast explain why the munmap() line causes Valgrind to report 0 "still reachable" leaks?
Edit:
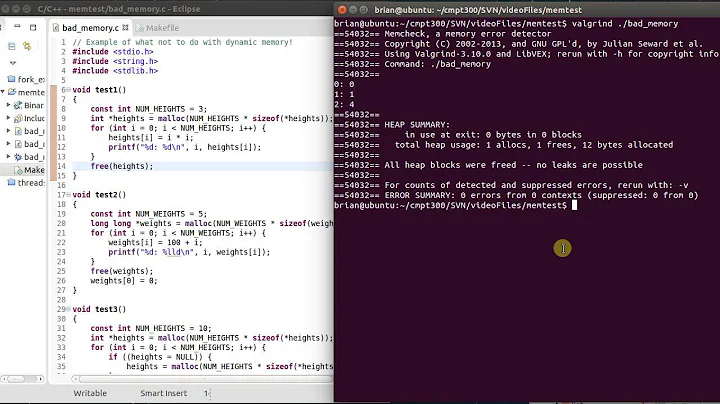
Here's a minimal test sample:
#include <stdio.h>
#include <stdlib.h>
#include <pthread.h>
void *runner(void *param) {
    /* some operations ... */
    pthread_exit(NULL);
}
int n;
int main(void) {
    int i;
    pthread_t *threadIdArray;
    n=10; /* for example */
    threadIdArray = malloc((n+n-1)*sizeof(pthread_t));
    for(i=0;i<(n+n-1);i++) {
        if( pthread_create(&threadIdArray[i],NULL,runner,NULL) != 0 ) {
            printf("Couldn't create thread %d\n",i);
            exit(1);
        }
    }
    for(i=0;i<(n+n-1);i++) {
        pthread_join(threadIdArray[i],NULL);
    }
    free(threadIdArray);
    return(0);
}
Run with:
valgrind -v --leak-check=full --show-reachable=yes ./a.out-
 jww over 4 years
-
-
Admin about 12 yearscan you surmise what the munmap() is doing that makes the "still reachable" blocks disappear?
-
 Dan Moulding about 12 years@crypto: It could be that
munmapis invoked as a result of unloading a shared object. And all resources used by the shared object might be getting freed before it is unloaded. This could explain why the "still reachables" are getting freed in themunmapcase. I'm just speculating here, though. There's not enough information here to say for sure. -
Admin about 12 yearsI am getting 0 errors just like you. Please check the leak summary for info on the "leaks".
-
 Jens Gustedt about 12 years@crypto: I don't understand. You mean you have the same supressions as I have?
 -
Admin about 12 yearsused_suppression: 14 dl-hack3-cond-1 <- that's what I get
-
 Toymakerii almost 10 yearsThis conflicts with the other verbage provided by Valgrind as well as technically incorrect. The memory was "still reachable" at program exit and thus potentially a leak. What if you were debugging code to run on an RTOS which does not clean up memory well after program exit?
 -
 Cyan over 7 yearsUnfortunately, that's not always true. Lost File descriptors for example can count as memory leak, but valgrind classify them as "still reachable", presumably because the pointers leading to them are still accessible within a system table. But for the purpose of debugging, the real diagnosis is a "memory leak".
 -
 Employed Russian over 7 yearsLost file descriptors are not memory leaks by definition. Maybe you are talking about lost
FILEpointers? -
 lvella over 7 yearsOne case where "still reachable" memory can be considered a memory leak: assume you have a hash table where you add pointers to heap allocated memory as value. If you keep inserting new entries on the table, but won't remove and free those you don't need anymore, it can grow indefinitely, leaking heap memory event if that memory is thecnically "still reachable". This is the case of memory leak you can have in Java or other garbage collected languages.
 -
 John Perry over 6 yearsSee also this answer in the valgrind FAQ about "still reachable" blocks that are created by STL. valgrind.org/docs/manual/faq.html#faq.reports
 -
jww over 4 years"many programmers (rightly) argue that [leaked memory] don't actually pose [a] problem, and therefore should not be considered true memory leaks" - Lol... Build a native DLL with that sort of memory leak, and then have Java or .Net consume it. Java and .Net load and unload DLLs thousands of times during life of a program. Each time the DLL is reloaded it will leak a little more memory. Long running programs will eventually run out of memory. It drives Debian's OpenJDK maintainer mad. He said the same on the OpenSSL mailing list while we were discussing OpenSSL's "benign" memory leaks.
-
 huseyin tugrul buyukisik about 4 yearsIs eclipse cdt(on linux)'s oxygen(or was it doxygen?)'s 5GB memory consumption after idling for a few hours, connected with this benign leak? Also when I use a simple C++ class with only a shared_ptr member to a vector still gives this same "still reachable" error. If smart pointers are still reachable, then C++ is still reachable. It says its C++.
 -
 12431234123412341234123 over 2 yearsThere is also a other type of leak: Some data is stored in a list, no longer used but not freed while the program is running. The programs stores more and more data in that list but does not free any of them while it still runs. Only when the program is closing, all the elements in that list are freed. This kinds are harder to detect since Valgrind can not show an error for this kind.
 -
 ZachB about 2 yearsValgrind only reports leaked file descriptors with
--track-fds=yes. They will not be reported as "still reachable." -
 syockit almost 2 yearsWell, if it was opened with
fopen, then the leak will be for theFILEstruct. -
 Student 7 monthsstill reachable blocks could also result in memory exhaustion if the process left to run for a long time!
 -
Student 6 monthsWe are talking here about run-time memory usage, right? How can it be, that "still reachable" allocated memory is different from "true leaks" in terms of space they claim?! It still is allocated on the heap just like the "true leaks", and could drive you into memory depletion.