Swap x and y axis without manually swapping values
Solution 1
Click somewhere on the chart to select it.
You should now see 3 new tabs appear at the top of the screen called "Design", "Layout" and "Format".
Click on the "Design" tab.
There will be a button called "Switch Row/Column" within the "data" group, click it.
Solution 2
-Right click on either axis
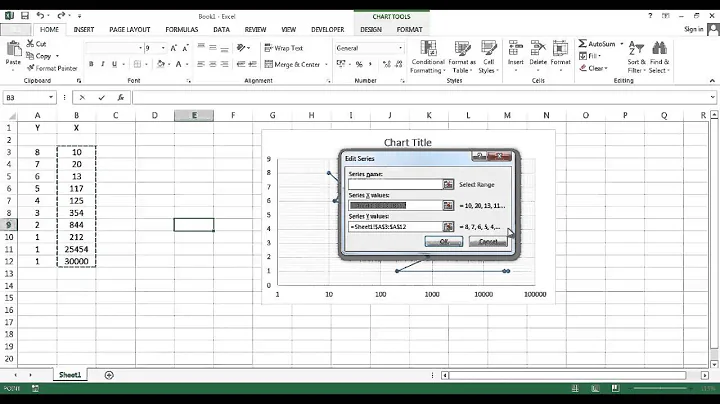
-Click "Select Data..."
-Then Press the "Edit" button
-Copy the "Series X values" to the "Series Y values" and vise versa finally hit ok
I found this answer on this youtube video https://www.youtube.com/watch?v=xLKIWWIWltE
Solution 3
Microsoft Excel for Mac 2011 v 14.5.9
- Click on the chart
- Press the "Switch Plot" button under the "Charts" tab
Solution 4
Using Excel 2010 x64. XY plot: I could not see no tabs (it is late and I am probably tired blind, 250 limit?). Here is what worked for me:
Swap the data columns, to end with X_data in column A and Y_data in column B.
My original data had Y_data in column A and X_data in column B, and the graph was rotated 90deg clockwise. I was suffering. Then it hit me:
an Excel XY plot literally wants {x,y} pairs, i.e. X_data in first column and Y_data in second column. But it does not tell you this right away.
For me an XY plot means Y=f(X) plotted.
Related videos on Youtube
 02 : 28
 01 : 46
 01 : 09
 01 : 31
 04 : 12
 01 : 59
 02 : 29
Comments
-
flux almost 2 years
So I have a set of data that has conditional formatting. Basically it's a set of photometric measurements of stars that I want to put on a chart with different colors for stars in different ranges of Color Index (basically color them by their spectral class). So my data looks like this: Stars Data
- The first column is the Absolute Magnitude (M) of the star - I want this on the X axis
- The rest of the columns are the different spectral classes that have values from another column only in a particular range. - I want these on the Y axis.
- Currently the chart looks like this and all I want to do is swap the axes, but I cant seem to do it.
-
GreenAsJade over 8 yearsWhat do you do if you don't get a Design tab?
-
Ben K. over 7 yearsThis does not swap the X and Y axes, this switches column data for row data. I haven't found any easy way of switching both axis which is a real pain.
-
 Sergio Abreu over 7 yearsThanks. Excel puts data according to the column position. To swap coordinates, one option is to copy the left column to the right. Solved for me too.
 -
Sifu over 7 years@user1901493 If you want to switch the selection of both axis, just drag the selection boxes over (When you click on the chart, you can see two highlighted boxes on your data, swap them). That's the easiest way I know.
-
Ben K. over 7 yearsThat is indeed a possibility I hadn't considered. Thank you!
-
HongboZhu over 4 yearsThis works for
scatterplot. Wonder why there is not button for it. -
Yaman K Singla about 3 yearsFor switching x and y axis (and not column and row simply), right click, go to select data option, swap the values in the "x values" and "y values" text-fields.