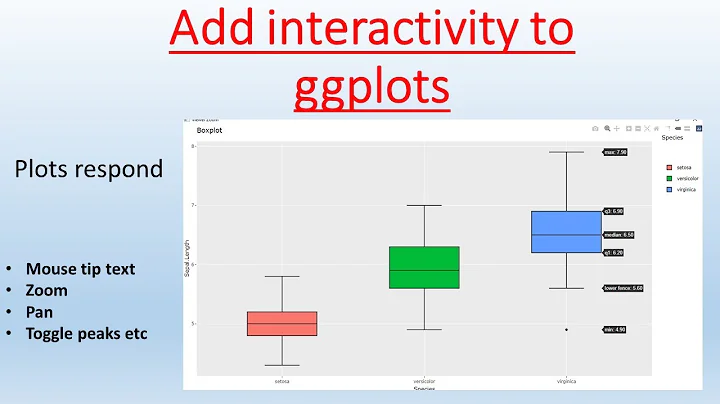
ToolTip when you mouseover a ggplot on shiny
Solution 1
If I understand the question correctly, this can be achieved with the recent update of the shiny package for both the ggplot2 and the base package. Using this example from Winston Chang and Joe Cheng http://shiny.rstudio.com/gallery/plot-interaction-basic.html , I was able to solve this problem. Hover is now an input argument into plotOutput() so that is added to the ui along with a verbatimTextOutput to display mtcars$wt for the point hovered over.
In the server I basically make a distance vector which calculates the distance from the mouse to any point in the plot and if this distance is less than 3 (works in this application) then it shows mtcars$wt for the closest point to your mouse. To be clear input$plot_hover returns a list of info about the location of the mouse and only the x and y elements are extracted from input$plot_hover in this example.
library(ggplot2)
library(Cairo)   # For nicer ggplot2 output when deployed on Linux

ui <- fluidPage(
    fluidRow(
        column(width = 12,
               plotOutput("plot1", height = 350,hover = hoverOpts(id ="plot_hover"))
        )
    ),
    fluidRow(
        column(width = 5,
               verbatimTextOutput("hover_info")
        )
    )
)

server <- function(input, output) {


    output$plot1 <- renderPlot({

        ggplot(mtcars, aes(x=mpg,y=disp,color=factor(cyl))) + geom_point()

    })

    output$hover_info <- renderPrint({
        if(!is.null(input$plot_hover)){
            hover=input$plot_hover
            dist=sqrt((hover$x-mtcars$mpg)^2+(hover$y-mtcars$disp)^2)
            cat("Weight (lb/1000)\n")
            if(min(dist) < 3)
                mtcars$wt[which.min(dist)]
        }


    })
}
shinyApp(ui, server)
I hope this helps!
Solution 2
You can also use a little bit JQuery and conditional renderUI to show a custom tooltip near the pointer.
library(shiny)
library(ggplot2)

ui <- fluidPage(

  tags$head(tags$style('
     #my_tooltip {
      position: absolute;
      width: 300px;
      z-index: 100;
     }
  ')),
  tags$script('
    $(document).ready(function(){
      // id of the plot
      $("#plot1").mousemove(function(e){

        // ID of uiOutput
        $("#my_tooltip").show();
        $("#my_tooltip").css({
          top: (e.pageY + 5) + "px",
          left: (e.pageX + 5) + "px"
        });
      });
    });
  '),

  selectInput("var_y", "Y-Axis", choices = names(mtcars), selected = "disp"),
  plotOutput("plot1", hover = hoverOpts(id = "plot_hover", delay = 0)),
  uiOutput("my_tooltip")
)

server <- function(input, output) {

  data <- reactive({
    mtcars
  })

  output$plot1 <- renderPlot({
    req(input$var_y)
    ggplot(data(), aes_string("mpg", input$var_y)) +
      geom_point(aes(color = factor(cyl)))
  })

  output$my_tooltip <- renderUI({
    hover <- input$plot_hover
    y <- nearPoints(data(), input$plot_hover)[ ,c("mpg", input$var_y)]
    req(nrow(y) != 0)
    verbatimTextOutput("vals")
  })

  output$vals <- renderPrint({
    hover <- input$plot_hover
    y <- nearPoints(data(), input$plot_hover)[ , c("mpg", input$var_y)]
    # y <- nearPoints(data(), input$plot_hover)["wt"]
    req(nrow(y) != 0)
    # y is a data frame and you can freely edit content of the tooltip
    # with "paste" function
    y
  })
}
shinyApp(ui = ui, server = server)
EDITED:
After this post I searched internet to see whether it could be done more nicely and found this wonderful custom tooltip for ggplot. I believe it can hardly be done better than that.
Solution 3
Using plotly, you can just translate your ggplot into an interactive version of itself. Just call the function ggplotly on your ggplot object:
library(plotly)

data(mtcars)

shinyApp(
ui <- shinyUI(fluidPage(
  sidebarLayout(sidebarPanel( h4("Test Plot")),
    mainPanel(plotlyOutput("plot1"))
  )
)),

server <- shinyServer(
  function(input, output) {
    output$plot1 <- renderPlotly({
      p <- ggplot(data=mtcars,aes(x=mpg,y=disp,color=factor(cyl)))
      p <- p + geom_point()

      ggplotly(p)
    })
  }
))

shinyApp(ui, server)
For customizations of what is shown in the tooltip, look e.g. here.

Solution 4
I've released, together with my colleague, a package called GGTips (it's not on CRAN) that do just that, adding tooltips on plots. We created our own solution because we have trouble in recreating our complex plots using plotly that's not 100% compatible with ggplot2. Git repo have a link to online demo.

Related videos on Youtube
 04 : 46
 03 : 25
 12 : 46
 12 : 51
![[R Shiny Basic App] #7 Interactive ggplot Bar Chart using Reactive and Render](https://i.ytimg.com/vi/rlcUiSw49FY/hq720.jpg?sqp=-oaymwEcCNAFEJQDSFXyq4qpAw4IARUAAIhCGAFwAcABBg==&rs=AOn4CLAv1PBZa8-Qokb1ywtLQoRDEeQQxg) 10 : 24
10 : 24
![[R Shiny Basic App] #6 Bar plot using ggplot](https://i.ytimg.com/vi/LnmMPm1lTAg/hq720.jpg?sqp=-oaymwEcCNAFEJQDSFXyq4qpAw4IARUAAIhCGAFwAcABBg==&rs=AOn4CLAySxmqsuBKy9ANiIVjaPuy8trqDA) 02 : 53
02 : 53
 03 : 28 : 46
 08 : 56
guna
Updated on July 09, 2022Comments
-
guna almost 2 years
I am building a shiny application.
I am plotting charts using ggplot.
When I mouseover the points on the graph, I want a tooltip showing one of the columns in the data frame (customizable tooltip)
Can you please suggest the best way forward.
Simple App:
# ui.R

shinyUI(fluidPage(
 sidebarLayout(
    sidebarPanel(
        h4("TEst PLot")),
    mainPanel(
        plotOutput("plot1")
    )
)
))

# server.R

library(ggplot2)
data(mtcars)

shinyServer(
function(input, output) {
    output$plot1 <- renderPlot({
        p <- ggplot(data=mtcars,aes(x=mpg,y=disp,color=factor(cyl)))
        p <- p + geom_point()
        print(p)
    })
}
)
When I mouse over the points, I want it to show mtcars$wt
-
 Pork Chop over 9 yearsLook into Rcharts: stackoverflow.com/questions/17524227/… or GooglveVis:cran.r-project.org/web/packages/googleVis/vignettes/…
 -
guna over 9 yearsThanks. I do use both of them. But I want to use ggplot for plotting. And use its full flexibility. All I need is a tool tip.
-
 Carson over 9 yearsanimint is an R package that converts ggplot2 to SVG. Here is an example of embedding ggplot2/animint plots in shiny -- cpsievert.shinyapps.io/animintShiny To add a tooltip, you'd put
tooltip=wtinside ofaes() -
Carson over 9 yearsAnother option would to use the gridSVG package to convert to SVG yourself, then add a tooltip with the SVGAnnotation package.
-
 cho7tom almost 9 yearsThe new shinyBS package might be very helpful for this specific need: ebailey78.github.io/shinyBS/docs/…. It adds additional bootstrap functionalities to shiny and tooltips are part of them.
 -
Ignacio almost 9 yearswere you able to solve this? I would love to code that answers to this question
-
-
guna almost 9 yearsVeri Cool @Solvi. Thank you!
-
 divibisan over 6 yearsGreat find! The link in your edit is the best solution I've seen for this. One thing to keep in mind that Pawel doesn't mention is that if you scale either axis of your graph you will need to apply a similar transformation to your hover$x and/or hover$y variables before using them.
 -
 Ali Altıntaş over 3 yearsYour library is really cool for for this purpose. When I tried it, I noticed that
renderUIis used instead ofrenderPlotsin the server function. This feature prevents me using thehoverandbrushfeatures inrenderPlots. Do you have a solution for getting thehoverandbrushfeatures? (PS: I need them to extract selected datapoint for a table output) -
jcubic over 3 years@AliAltıntaş You can create issue on GitHub I will need to take a look, I'm not expert in R. Don't know what
hoverandbrushdo, will need to investigate.