What is private bytes, virtual bytes, working set?
Solution 1
The short answer to this question is that none of these values are a reliable indicator of how much memory an executable is actually using, and none of them are really appropriate for debugging a memory leak.
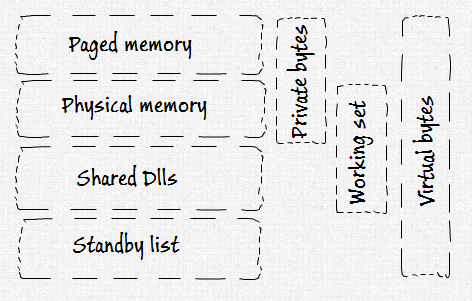
Private Bytes refer to the amount of memory that the process executable has asked for - not necessarily the amount it is actually using. They are "private" because they (usually) exclude memory-mapped files (i.e. shared DLLs). But - here's the catch - they don't necessarily exclude memory allocated by those files. There is no way to tell whether a change in private bytes was due to the executable itself, or due to a linked library. Private bytes are also not exclusively physical memory; they can be paged to disk or in the standby page list (i.e. no longer in use, but not paged yet either).
Working Set refers to the total physical memory (RAM) used by the process. However, unlike private bytes, this also includes memory-mapped files and various other resources, so it's an even less accurate measurement than the private bytes. This is the same value that gets reported in Task Manager's "Mem Usage" and has been the source of endless amounts of confusion in recent years. Memory in the Working Set is "physical" in the sense that it can be addressed without a page fault; however, the standby page list is also still physically in memory but not reported in the Working Set, and this is why you might see the "Mem Usage" suddenly drop when you minimize an application.
Virtual Bytes are the total virtual address space occupied by the entire process. This is like the working set, in the sense that it includes memory-mapped files (shared DLLs), but it also includes data in the standby list and data that has already been paged out and is sitting in a pagefile on disk somewhere. The total virtual bytes used by every process on a system under heavy load will add up to significantly more memory than the machine actually has.
So the relationships are:
- Private Bytes are what your app has actually allocated, but include pagefile usage;
- Working Set is the non-paged Private Bytes plus memory-mapped files;
- Virtual Bytes are the Working Set plus paged Private Bytes and standby list.
There's another problem here; just as shared libraries can allocate memory inside your application module, leading to potential false positives reported in your app's Private Bytes, your application may also end up allocating memory inside the shared modules, leading to false negatives. That means it's actually possible for your application to have a memory leak that never manifests itself in the Private Bytes at all. Unlikely, but possible.
Private Bytes are a reasonable approximation of the amount of memory your executable is using and can be used to help narrow down a list of potential candidates for a memory leak; if you see the number growing and growing constantly and endlessly, you would want to check that process for a leak. This cannot, however, prove that there is or is not a leak.
One of the most effective tools for detecting/correcting memory leaks in Windows is actually Visual Studio (link goes to page on using VS for memory leaks, not the product page). Rational Purify is another possibility. Microsoft also has a more general best practices document on this subject. There are more tools listed in this previous question.
I hope this clears a few things up! Tracking down memory leaks is one of the most difficult things to do in debugging. Good luck.
Solution 2
The definition of the perfmon counters has been broken since the beginning and for some reason appears to be too hard to correct.
A good overview of Windows memory management is available in the video "Mysteries of Memory Management Revealed" on MSDN: It covers more topics than needed to track memory leaks (eg working set management) but gives enough detail in the relevant topics.
To give you a hint of the problem with the perfmon counter descriptions, here is the inside story about private bytes from "Private Bytes Performance Counter -- Beware!" on MSDN:
Q: When is a Private Byte not a Private Byte?
A: When it isn't resident.
The Private Bytes counter reports the commit charge of the process. That is to say, the amount of space that has been allocated in the swap file to hold the contents of the private memory in the event that it is swapped out. Note: I'm avoiding the word "reserved" because of possible confusion with virtual memory in the reserved state which is not committed.
From "Performance Planning" on MSDN:
3.3 Private Bytes
3.3.1 Description
Private memory, is defined as memory allocated for a process which cannot be shared by other processes. This memory is more expensive than shared memory when multiple such processes execute on a machine. Private memory in (traditional) unmanaged dlls usually constitutes of C++ statics and is of the order of 5% of the total working set of the dll.
Solution 3
You should not try to use perfmon, task manager or any tool like that to determine memory leaks. They are good for identifying trends, but not much else. The numbers they report in absolute terms are too vague and aggregated to be useful for a specific task such as memory leak detection.
A previous reply to this question has given a great explanation of what the various types are.
You ask about a tool recommendation: I recommend Memory Validator. Capable of monitoring applications that make billions of memory allocations.
http://www.softwareverify.com/cpp/memory/index.html
Disclaimer: I designed Memory Validator.
Solution 4
There is an interesting discussion here: http://social.msdn.microsoft.com/Forums/en-US/vcgeneral/thread/307d658a-f677-40f2-bdef-e6352b0bfe9e/ My understanding of this thread is that freeing small allocations are not reflected in Private Bytes or Working Set.
Long story short:
if I call
p=malloc(1000);
free(p);
then the Private Bytes reflect only the allocation, not the deallocation.
if I call
p=malloc(>512k);
free(p);
then the Private Bytes correctly reflect the allocation and the deallocation.
pankajt
Updated on July 07, 2021Comments
-
pankajt almost 3 years
I am trying to use the perfmon windows utility to debug memory leaks in a process.
This is how perfmon explains the terms:
Working Set is the current size, in bytes, of the Working Set of this process. The Working Set is the set of memory pages touched recently by the threads in the process. If free memory in the computer is above a threshold, pages are left in the Working Set of a process even if they are not in use. When free memory falls below a threshold, pages are trimmed from Working Sets. If they are needed they will then be soft-faulted back into the Working Set before leaving main memory.
Virtual Bytes is the current size, in bytes, of the virtual address space the process is using. Use of virtual address space does not necessarily imply corresponding use of either disk or main memory pages. Virtual space is finite, and the process can limit its ability to load libraries.
Private Bytes is the current size, in bytes, of memory that this process has allocated that cannot be shared with other processes.
These are the questions I have:
Is it the Private Bytes which I should measure to be sure if the process is having any leaks as it does not involve any shared libraries and any leaks, if happening, will come from the process itself?
What is the total memory consumed by the process? Is it the Virtual Bytes or is it the sum of Virtual Bytes and Working Set?
Is there any relation between Private Bytes, Working Set and Virtual Bytes?
Are there any other tools that give a better idea of the memory usage?
-
Jay Zhu about 14 yearsI am afraid that you answer is not quite correct. Private Bytes refer to the amount of memory (RAM) that the process executable has asked for - not only physical memory. Thus you can surely inspect most of the memory leak cases by monitoring private bytes. Try ::VisualAlloc to commit a large chunk of memory (say 1.5G). You should be able to see that your private bytes are way larger than the working set. Which proves that your "Working Set is the Private Bytes plus Memory-mapped files" is incorrect.
-
Jay Zhu about 14 yearsActually, I beleive the write understanding is "Working Set is the in-memory Private Bytes plus Memory-mapped files". And Private Bytes CAN be swapped out - you can see private bytes larger than the physical memory you have in the machine.
-
G33kKahuna over 12 years@Aaronaught: Your first statement about reliable indicator and appropriate for debugging is confusing. Private bytes is a reliable indicator of a leak the application memory space. It could be a dependent DLL and indirect but it is a leak in the application memory space. Can you explain why it cannot be used for debugging? a full memory dump of the application process should tell us what is consuming this memory. I am not sure i understand why it cannot be used for debugging. Can you shed some light?
-
Aaronaught over 12 years@G33kKahuna: It's not clear to me how a memory dump would tell you what is consuming the memory in any meaningful sense - unless by "what" you mean "what modules", but then all you have is a snapshot, you still cannot see which module is actually leaking the memory over time unless you take several dumps over time and under tightly controlled conditions. It's hard to conceive of a more inefficient and unreliable debugging strategy. Profilers are everywhere these days; use one.
-
G33kKahuna about 12 years@Aaronaught: a full memory dump gives you all information you need for analysis. Private bytes are reserved by the code in question not OS or any extraneous factors. So, a full memory dump will show indicators of where the memory is spent. Few analysis steps should put you on the right track. For ex: !address should tell you whether the memory was committed or reserved. Committed should tell us the private bytes are being used up. If the memory is just reserved, then your application is like SQL Server where the memory is not released but empty spaces are held. read next
-
G33kKahuna about 12 yearsRun a full !objsize, this should show any pinned objects in the immediate heap. You can confirm by checking the eeheap -gc. This should show you where the volume is stuck. Typically, if no hints are available with all of the above commands, your private bytes are consumed by uncollected objects in GC. Now move on to either gchandles or gcleaks. These commands should tell you what types/ object address cannot be mapped. The pointer is still there but object is gone. This is such categorical problem for unreleased event handlers.
-
G33kKahuna about 12 yearsIf you run a gcroot on these objects it should tell you whetther the gcroot is pinned. if it is, run a objsize on the pinned handle and it should return the size that is pinned. for the lazy, use tools like MEM Profiler. it will atleast point you to direct rooted objects & delegates, indirect objects & delegates. These are typically most causes of hidden private bytes leak
-
 jn1kk about 12 yearsI can't even run a simple class file (in Java)? What gives?
 -
Robert Koritnik about 12 yearsI suspect that Stephen and Devil are somehow related or even cloned... :D ;)
-
Kyberias almost 11 yearsThis is explained by the fact that the C standard library memory functions use a custom or Win32 Heap which is a memory management mechanism on top of the low-level process-level memory management.
-
 Louis Duran over 9 yearsIf you are doing .NET development a very good tool that I have used in the past for actually finding the source of the memory leak is RedGate software's ANTS Memory profiler. It will show you exactly which objects are retained in memory. It is still up to you to know which shouldn't be in memory and steps to take to assure that they are not but just telling you what is retained is usually enough to figure it out.
 -
Pacerier about 9 years@Kyberias, So how do we get below that?
-
Pacerier about 9 years@StephenKellett, Is there a trial version?
-
Bradley A. Tetreault about 9 years@Pacerier if you follow the link there is a trial for both the x86 and x64 versions just above the buy option on the left of the page.
-
 franckspike almost 9 yearswhile(1) free(malloc(1000)); // Would this cause Private Bytes to increase forever ?
 -
Miral almost 9 years@franckspike: no, it will increase to a certain point (generally about 4 kB, but this can vary) and then stop, because the CRT will re-use previously freed memory instead of requesting new pages from the OS.
-
mx1up over 6 yearsthis is the updated link to the visual studio page for memory leak detection. Note that in the process of moving to the new documentation platform, the title of the page has changed from "Memory Leak Detection and Isolation" to "Finding Memory Leaks Using the CRT Library".
-
slagathor over 6 yearsHow would this relate to memory values found on Linux (i.e. values in the .../statm file)? Would the resident memory be similar to working set, and (resident - shared) be the private bytes?
-
Bruno Brant about 6 yearsup vote because of the insanely good examples about how it's broken!
-
Jamie Hanrahan over 5 yearsThe first quote is mistaken. Allocating "Private bytes" doesn't require anything be "allocated in the swap file" (which is really called the pagefile). You don't even have to have a pagefile for "private bytes" to be allocated. In fact, allocating private bytes doesn't immediately use any space anywhere, and may not ever use as much as was allocated.
-
Jamie Hanrahan over 5 yearsThe second quote isn't much better. Private bytes used in DLL code is not necessarily mostly statically allocated within the DLL. DLL code is perfectly free to call VirtualAlloc, HeapAlloc (malloc and new in the CRTL), etc. It also tries to describe private memory size as a percentage of working set size, which is nonsensical. The former is a virtual size (and will be the same for every use of the code with the same input) while the latter is physical (which can be radically different from one run to the next, depending on how much memory-rich or -starved the machine is).
-
Jamie Hanrahan over 5 years@Pacerier: You can call VirtualAlloc and VirtualFree.
-
 gast128 almost 5 yearsCRT and the Heap manager are built on top of the VirtualAlloc. The commit size increases and decreases when using VirtualAlloc and VirtualFree but be aware of this remark in MSDN: 'Actual physical pages are not allocated unless/until the virtual addresses are actually accessed.'
 -
FalcoGer over 4 yearsSo since working set includes memory shared files, will that also mean that the memory is shared? so if I have 5 processes that use the same libraries, each indicating 10GB of WorkingSet usage, can they share 9.9GB between each other so the total amount of actual memory used is 10.4GB?
-
caramel1995 about 4 yearsIn other words, it can be said that Virtual Bytes = Private Bytes + Memory Mapped Files?
-
 zeroG almost 2 years