How to do memory profiling on Windows?
Solution 1
See Application Verifier, LeakDiag, UMDH, and Debugging Tools for Windows in general.
All of which are free.
For a guide on how to use them, see Advanced Windows Debugging.
Solution 2
I would start with using the Perfmon.exe tool (just type perfmon.exe at the "run" prompt). With this tool you can add counters like "Private bytes", "Handle count" , "Thread count" etc for profiling your application over time.
There is allot of interesting information that can be extracted using this tool and there is plenty of information on MSDN that covers how to use it, its not only limited to memory leaks, it can benchmark I/O performance and other stuff as well.
Remember that for each counter type you can enable an short description that will outline the purpose of the counter (I think its default off).
Solution 3
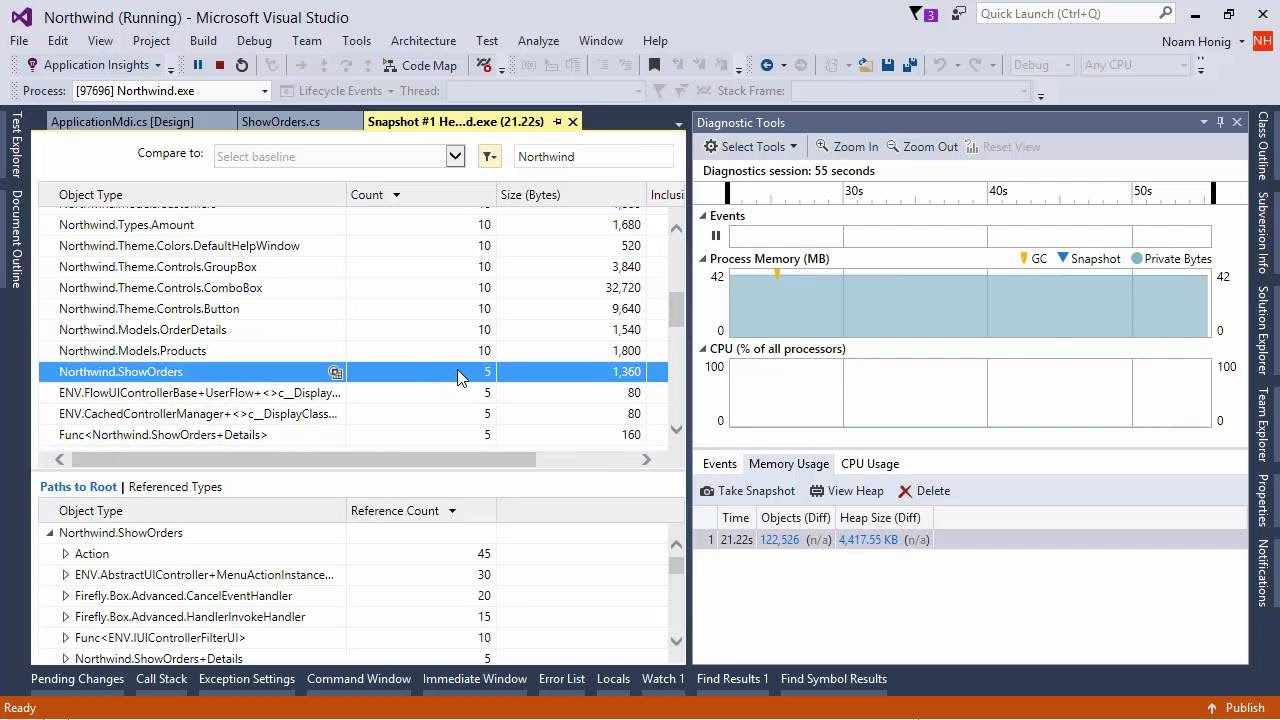
There is no inbuilt tool in VS for memory profiling for unmanaged applications.
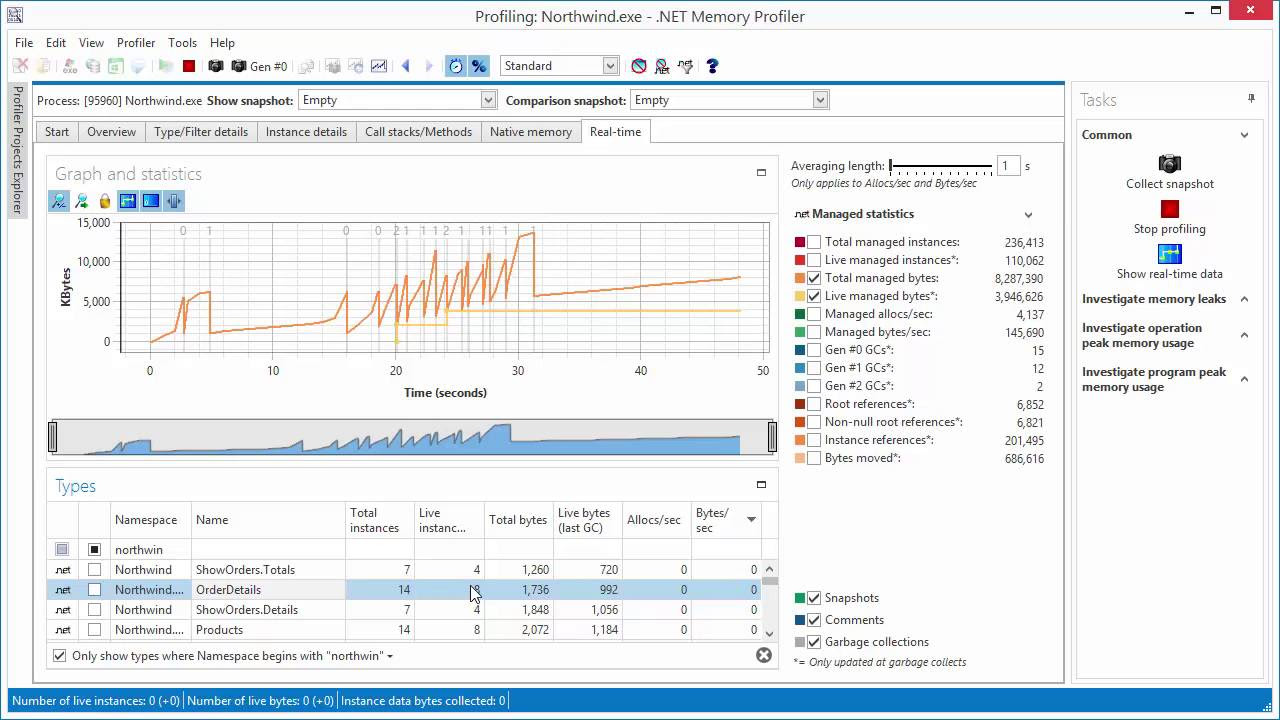
For other third party tools, see this post : Is it possible to detect GDI leaks from the Visual Studio debugger?
Related videos on Youtube
![How To Fix High RAM/Memory Usage on Windows 10 [Complete Guide]](vi/osKnDbHibig/hq720_sqp--oaymwEcCNAFEJQDSFXyq4qpAw4IARUAAIhCGAFwAcABBg---rs-AOn4CLDgajRq6bP7JD1erNguFVloL0gqUA.jpg) 12 : 54
12 : 54
 26 : 05
 03 : 22
 05 : 17
 04 : 58
 06 : 34
 13 : 04
 11 : 12
 08 : 20
 04 : 40
bastibe
I am an scientist / engineer with specialization in signal processing and audio technology.
Updated on June 04, 2022Comments
-
 bastibe 5 months
Possible Duplicate:
Memory leak tool for C++ under WindowsI used to work on a Mac project and one thing I really enjoyed about XCode was its profiler. I found many a bug by just running my program with various settings of that profiler. Most notably, it would show me which parts of my program consumed memory, it would show me if it leaked memory and it would show me when it would do that. If I was working with a GUI application, it would even show me screenshots of what I was doing when those allocations/leaks/deallocations occurred.
Nowadays, I am working on a Windows/C++ project using Visual Studio and I suspect the project to consume too much memory and possibly leak some memory, too. Using XCode, I would just fire up that profiler and immediately know what's happening. In Visual Studio however, I can find no such thing (there is a somewhat awkward performance profiler, but CPU time is not my concern here).
So, how would you go about searching for leaks and code with too much memory consumption?
-
bastibe almost 12 years@Kirill: That question was asked a year ago specifically targeting Visual Studio 2005. That software is now more than five years old. I am asking for a general purpose tool regardless of Visual Studio version. Also, I am asking not just about leaks but also about general memory consumption. I think this should qualify as a different question as the one you recommend.
-