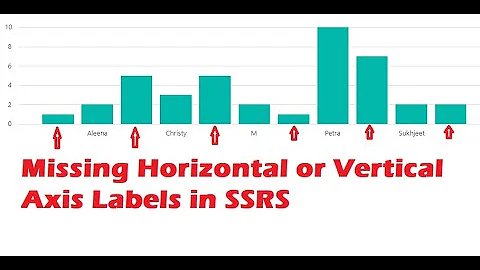
Excel Chart not showing SOME X-axis labels
Solution 1
Mine disappeard because the Column with the data was hidden. Unhiding the column fixed it. Not sure why this is related.
Solution 2
I had a similar problem I think it's somewhat related to what was brought up in this thread, although I didn't really follow. What I did to make it work was the following:
On the legend entries (series) section I clicked edit for each series and confirmed they were the right series.
I think clicked "edit" on the Horizontal (category) Axis labels and confirmed it was the correct selection (in my case I had to extend the range to incorporate added data)
Once this was complete the values showed up in the horizontal (category) Axis labels and when I selected them it populated my chart.
I recognize this is only a work around so if anyone knows the root cause and how to prevent it that would be great.
Related videos on Youtube
 03 : 30
 01 : 16
 03 : 35
 02 : 54
 04 : 40
dsbalaban
Updated on September 18, 2022Comments
-
dsbalaban over 1 year
I have a chart that refreshes after a dataload, and it seems like when there are more than 25 labels on the x-axis, the 26th and on do not show, though all preceding values do. Also, the datapoints for those values show in the chart. In the chart data window, the labels are blank.

Any ideas?
-
 Adam about 7 yearsAre they showing up on the graph itself? Could you post the "Series X Values" definition (from clicking on "edit" in the shot you posted.) Also post a shot of the corresponding range on your sheet.
 -
dsbalaban about 7 yearsno, they are not showing on the graph itself either. They ARE showing in the data range in the sheet though.
-
Adam about 7 yearsCould you post the "Series X Values" definition (from clicking on "edit" in the shot you posted.) Also post a shot of the corresponding range on your sheet.
-