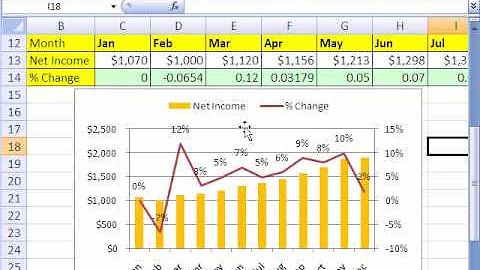
Excel: Charting date, time elapsed, and another value
As far as I know the function box shows the time in the system format. Why is it important how the function box display the time? It only means excel detect it is in the datetime format (usually a good thing). From there you can customize how the cells display that datetime (this is where you choose the correct format
If you want the time displayed as 14:04:05 in your cells (hence, in your graphic) you can use this custom format: "hh:mm:ss" or pick one of the predefined datetime format.
If you want to extract the numbers to do calculation with them you can use the following formulas: hour(yourdatetimecell) minute(yourdatetimecell) second(yourdatetimecell)
EDIT : You can work your way with converting your datetime into a sum of minute or a sum of seconds and graph it just like any other number. + Using the scatter graph format I have no issue creating a graph of duration expressed as hh:mm:ss (even if theres an am/pm or even a date showing up in the function bar)
If I'm to chart the following making sure to use two different Y axis for the value of the second and 3rd columns, scatter plot works fine.
11/12/2012  10  4:55:08
12/12/2012  10  3:55:08
1/12/2013   11  4:55:08
2/12/2013   12  7:55:08
3/12/2013   11  3:55:08
4/12/2013   10  7:55:08
5/12/2013   9   6:55:08
6/12/2013   12  6:55:08
7/12/2013   15  14:06:38
8/12/2013   16  48:05:39
Related videos on Youtube
 06 : 41
 07 : 16
 07 : 21
 24 : 03
 02 : 23
Ravindra Bawane
Updated on September 18, 2022Comments
-
 Ravindra Bawane over 1 year
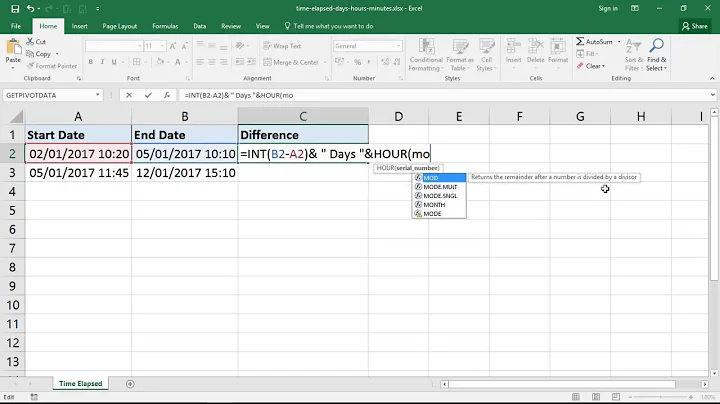
I'm trying to chart growth in our nightly backups. The three values I'm using are the date of the backup, the backup job size in bytes, and the time the job took to completely in hh:mm:ss.
Using Excel 2010, I'm having a devil of a time convincing Excel that the elapsed time is a number of hours, minutes, and seconds, and not a time of day.
I've tried using Time formats, and a few custom formats that appear not to use an AM/PM value, but all to no avail. The values are still firmly showing an AM/PM in the function box.
I also tried removing all " AM" from the spreadsheet after setting the format to one of these AM/PM-less formats. No difference, the AM/PM's are still there.
Once I can cajole Excel into accepting the values for what I want them to be and not what it thinks they ought to be, I'd like to chart them using two vertical axis': One for the job size and one for job time. The horizontal axis would be job date. This should allow me to graphically represent the growth of data we backup and the time it takes to backup that data and compare these values relatively.
UPDATE clarifying based on first response:
It is not important to me how the data is displayed. What is important to me is that the data I enter reflects correctly what it is that data truly is.
For a value entered of 6:03:23, I do not mean the value represet 3 minutes and 23 seconds after 6 o'clock in the morning. That value should reprsent 6 hours, 3 minutes, and 23 seconds of time, regardless of where or when that period originated. It is a measurement, not a reference point.
Excel seems to think I am refering to the reference point of time on the clock, not to a measurement of time that has elapsed during a process.
So long as Excel thinks I'm refering to a point of time and not a measured chunk of it, it will not be able to recognize what it is I am comparing and this will not graph it appropriately.
-
Ravindra Bawane over 12 yearsYea, I've got it laid out as such: Column A is date. Colum B is bytes. Column C is time.
-
Ravindra Bawane over 12 yearsThank you for your help. I've now got a very nice chart showing data growth as one Y-axis and job time as a second Y-axis, charted as a scatter plot with a trendline indicating that for each increment of job size, the job time increases at a decreasing rate. Just what I need.