How to debug JavaScript code with Netbeans?
Solution 1
HTML5 project is always debugging and running at the same time if you run it in any browser with NetBeans connector (check the browser switcher in toolbar). So once you run project/file, if some breakpoint should be hit, it will be. Therefore debug action is not enabled for HTML5 project, because it is the same as Run action.
Basically it means you can debug JS in Chrome with NetBeans Connector, Embedded browser in IDE, Chrome on Android, Safari on iOS...
Solution 2
I also ran into issues when trying to debug JavaScript in a PHP project. I was using Chrome as my browser and had confirmed that the Netbeans Connector extension was installed and working in Chrome.
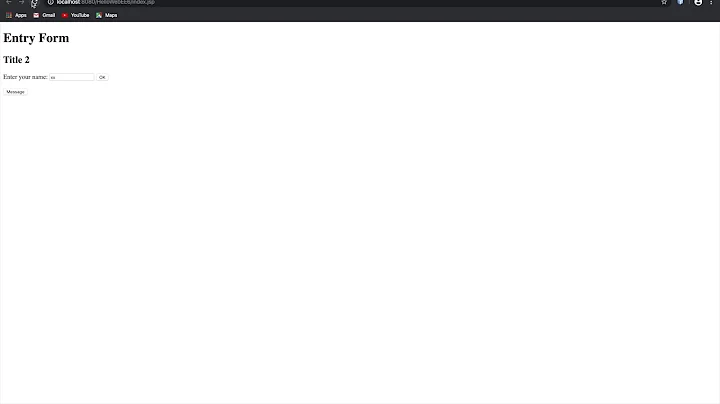
I could debug PHP without any issues. I could create a separate HTML5/JavaScript project and debug JavaScript without any problem. However, when I tried to set breakpoints on JavaScript code that was embedded in tags within the PHP file, I would get the little 'broken' breakpoints that everyone else references. When I selected the option to debug project, I could debug the PHP code, but the JavaScript breakpoints were never hit.
The change that I made that finally (for me) caused the JavaScript breakpoints to be hit so I could step through code using the Netbeans debugger was to remove the Javascript from the file containing the PHP/HTML code and place the JavaScript in a separate file that only contained JavaScript via a within the PHP file. Magically, I could debug both JavaScript and PHP within the same debugging session without any extra setup.
Of course, one alternative is to use the debugger within the browser, such as Chrome developer tools, but I really wanted to be able to debug everything from within the same Netbeans environment. Works like a charm now.
Related videos on Youtube
 00 : 35
 13 : 03
 04 : 15
 03 : 27
 02 : 52
 11 : 41
 09 : 25
 06 : 55
lolveley
Updated on September 14, 2022Comments
-
lolveley over 1 year
I am not experienced in developing web apps with NetBeans.
I created an HTML5 project with existing sources (some HTML, JS and CSS files), the import seems to be OK, but I didn't manage to debug JavaScript code, because the "Debug project", "Debug file" and "Debug test file" menu items are always disabled.
What have I missed?
PS.: I downloaded a fresh version in November 2013.