Adding scale bar to ggplot map
Solution 1
There is a package called ggsn, which allows you to customize the scale bar and north arrow.
ggplot() +
geom_path(aes(long, lat, group=group), data=worldUk, color="black", fill=NA) +
coord_equal() +
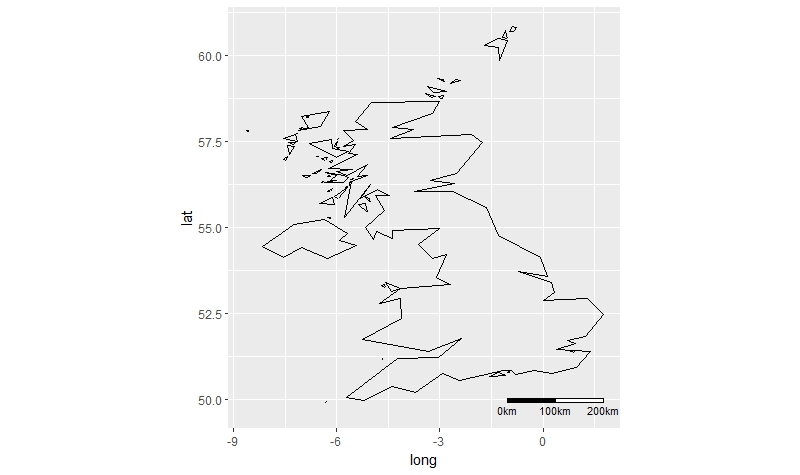
ggsn::scalebar(worldUk, dist = 100, st.size=3, height=0.01, dd2km = TRUE, model = 'WGS84')
Solution 2
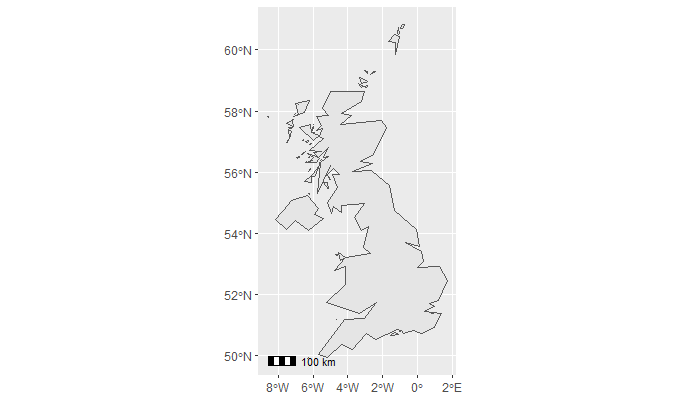
Another option is annotation_scale from the ggspatial package. Some more hints on this blog post.
library(ggplot2)
library(maptools)
data(wrld_simpl)
world_sf <- sf::st_as_sf(wrld_simpl)
worldUk <- subset(world_sf, NAME == 'United Kingdom')
Plot the layer and add the scale bar.
library(ggspatial)
ggplot() +
  geom_sf(data = worldUk) +
  annotation_scale()
Solution 3
I found this answer on http://editerna.free.fr/wp/?p=76 and I found it simple and worked perfectly so I must share it!
It is simple, first paste the code below into your console (no need for editing)
 library(maps)
 library(maptools)
 library(ggplot2)
 library(grid)
 #Then, we need a function to get the scale bar coordinates:
 #
 # Result #
 #--------#
 # Return a list whose elements are :
 #   - rectangle : a data.frame containing the coordinates to draw the first rectangle ;
 #   - rectangle2 : a data.frame containing the coordinates to draw the second rectangle ;
 #   - legend : a data.frame containing the coordinates of the legend texts, and the texts as well.
 #
 # Arguments : #
 #-------------#
 # lon, lat : longitude and latitude of the bottom left point of the first rectangle to draw ;
 # distanceLon : length of each rectangle ;
 # distanceLat : width of each rectangle ;
 # distanceLegend : distance between rectangles and legend texts ;
 # dist.units : units of distance "km" (kilometers) (default), "nm" (nautical miles), "mi" (statute miles). createScaleBar <-
 function(lon,lat,distanceLon,distanceLat,distanceLegend, dist.units =
 "km"){
     # First rectangle
     bottomRight <- gcDestination(lon = lon, lat = lat, bearing = 90, dist = distanceLon, dist.units = dist.units, model = "WGS84")
     topLeft <- gcDestination(lon = lon, lat = lat, bearing = 0, dist = distanceLat, dist.units = dist.units, model = "WGS84")
     rectangle <- cbind(lon=c(lon, lon, bottomRight[1,"long"], bottomRight[1,"long"], lon),
     lat = c(lat, topLeft[1,"lat"], topLeft[1,"lat"],lat, lat))
     rectangle <- data.frame(rectangle, stringsAsFactors = FALSE)
     # Second rectangle t right of the first rectangle
     bottomRight2 <- gcDestination(lon = lon, lat = lat, bearing = 90, dist = distanceLon*2, dist.units = dist.units, model = "WGS84")
     rectangle2 <- cbind(lon = c(bottomRight[1,"long"], bottomRight[1,"long"], bottomRight2[1,"long"], bottomRight2[1,"long"],
 bottomRight[1,"long"]),
     lat=c(lat, topLeft[1,"lat"], topLeft[1,"lat"], lat, lat))
     rectangle2 <- data.frame(rectangle2, stringsAsFactors = FALSE)
     # Now let's deal with the text
     onTop <- gcDestination(lon = lon, lat = lat, bearing = 0, dist = distanceLegend, dist.units = dist.units, model = "WGS84")
     onTop2 <- onTop3 <- onTop
     onTop2[1,"long"] <- bottomRight[1,"long"]
     onTop3[1,"long"] <- bottomRight2[1,"long"]
     legend <- rbind(onTop, onTop2, onTop3)
     legend <- data.frame(cbind(legend, text = c(0, distanceLon, distanceLon*2)), stringsAsFactors = FALSE, row.names = NULL)
     return(list(rectangle = rectangle, rectangle2 = rectangle2, legend = legend)) } We also need a function to obtain the coordinates of the North arrow:
 #
 # Result #
 #--------#
 # Returns a list containing :
 #   - res : coordinates to draw an arrow ;
 #   - coordinates of the middle of the arrow (where the "N" will be plotted).
 #
 # Arguments : #
 #-------------#
 # scaleBar : result of createScaleBar() ;
 # length : desired length of the arrow ;
 # distance : distance between legend rectangles and the bottom of the arrow ;
 # dist.units : units of distance "km" (kilometers) (default), "nm" (nautical miles), "mi" (statute miles). createOrientationArrow <-
 function(scaleBar, length, distance = 1, dist.units = "km"){
     lon <- scaleBar$rectangle2[1,1]
     lat <- scaleBar$rectangle2[1,2]
     # Bottom point of the arrow
     begPoint <- gcDestination(lon = lon, lat = lat, bearing = 0, dist = distance, dist.units = dist.units, model = "WGS84")
     lon <- begPoint[1,"long"]
     lat <- begPoint[1,"lat"]
     # Let us create the endpoint
     onTop <- gcDestination(lon = lon, lat = lat, bearing = 0, dist = length, dist.units = dist.units, model = "WGS84")
     leftArrow <- gcDestination(lon = onTop[1,"long"], lat = onTop[1,"lat"], bearing = 225, dist = length/5, dist.units =
 dist.units, model = "WGS84")
     rightArrow <- gcDestination(lon = onTop[1,"long"], lat = onTop[1,"lat"], bearing = 135, dist = length/5, dist.units =
 dist.units, model = "WGS84")
     res <- rbind(
             cbind(x = lon, y = lat, xend = onTop[1,"long"], yend = onTop[1,"lat"]),
             cbind(x = leftArrow[1,"long"], y = leftArrow[1,"lat"], xend = onTop[1,"long"], yend = onTop[1,"lat"]),
             cbind(x = rightArrow[1,"long"], y = rightArrow[1,"lat"], xend = onTop[1,"long"], yend = onTop[1,"lat"]))
     res <- as.data.frame(res, stringsAsFactors = FALSE)
     # Coordinates from which "N" will be plotted
     coordsN <- cbind(x = lon, y = (lat + onTop[1,"lat"])/2)
     return(list(res = res, coordsN = coordsN)) } The last function enables the user to draw the elements:
 #
 # Result #
 #--------#
 # This function enables to draw a scale bar on a ggplot object, and optionally an orientation arrow #
 # Arguments : #
 #-------------#
 # lon, lat : longitude and latitude of the bottom left point of the first rectangle to draw ;
 # distanceLon : length of each rectangle ;
 # distanceLat : width of each rectangle ;
 # distanceLegend : distance between rectangles and legend texts ;
 # dist.units : units of distance "km" (kilometers) (by default), "nm" (nautical miles), "mi" (statute miles) ;
 # rec.fill, rec2.fill : filling colour of the rectangles (default to white, and black, resp.);
 # rec.colour, rec2.colour : colour of the rectangles (default to black for both);
 # legend.colour : legend colour (default to black);
 # legend.size : legend size (default to 3);
 # orientation : (boolean) if TRUE (default), adds an orientation arrow to the plot ;
 # arrow.length : length of the arrow (default to 500 km) ;
 # arrow.distance : distance between the scale bar and the bottom of the arrow (default to 300 km) ;
 # arrow.North.size : size of the "N" letter (default to 6). scaleBar <- function(lon, lat, distanceLon, distanceLat, distanceLegend,
 dist.unit = "km", rec.fill = "white", rec.colour = "black", rec2.fill
 = "black", rec2.colour = "black", legend.colour = "black", legend.size = 3, orientation = TRUE, arrow.length = 500, arrow.distance = 300, arrow.North.size = 6){
     laScaleBar <- createScaleBar(lon = lon, lat = lat, distanceLon = distanceLon, distanceLat = distanceLat, distanceLegend =
 distanceLegend, dist.unit = dist.unit)
     # First rectangle
     rectangle1 <- geom_polygon(data = laScaleBar$rectangle, aes(x = lon, y = lat), fill = rec.fill, colour = rec.colour)
     # Second rectangle
     rectangle2 <- geom_polygon(data = laScaleBar$rectangle2, aes(x = lon, y = lat), fill = rec2.fill, colour = rec2.colour)
     # Legend
     scaleBarLegend <- annotate("text", label = paste(laScaleBar$legend[,"text"], dist.unit, sep=""), x =
 laScaleBar$legend[,"long"], y = laScaleBar$legend[,"lat"], size =
 legend.size, colour = legend.colour)
     res <- list(rectangle1, rectangle2, scaleBarLegend)
     if(orientation){# Add an arrow pointing North
         coordsArrow <- createOrientationArrow(scaleBar = laScaleBar, length = arrow.length, distance = arrow.distance, dist.unit =
 dist.unit)
         arrow <- list(geom_segment(data = coordsArrow$res, aes(x = x, y = y, xend = xend, yend = yend)), annotate("text", label = "N", x =
 coordsArrow$coordsN[1,"x"], y = coordsArrow$coordsN[1,"y"], size =
 arrow.North.size, colour = "black"))
         res <- c(res, arrow)
     }
     return(res) }
Now, to plot onto a map!
First create your ggplot map, and add the scale bar as an extra layer, using the « + » sign:
 your_ggplot_object -> your_ggplot_object + scaleBar(lon = -130, lat = 26, distanceLon = 500,
 distanceLat = 100, distanceLegend = 200, dist.unit = "km")
On the example above, I call the « scaleBar » function, and I specify some values for the arguments. For instance, lon = -130, lat = 26 means I want the bottom left point of the rectangle to be at (-130,26). You need to define the other values of each argument according to what you want (there is a description of each argument in the header of the function).
Solution 4
I would suggest annotate(), which would allow you to draw segments of the proper length right in the plotting area. You could then add text above/below as a label.
Related videos on Youtube
 11 : 37
luciano
Updated on July 09, 2022Comments
-
 luciano over 1 year
I've produced this map in
ggplot2:library(maptools); library(ggplot2) data(wrld_simpl) world <- fortify(wrld_simpl) worldUk <- subset(world, id=="GBR") ggplot() + geom_path(aes(long, lat, group=group), data=worldUk, color="black", fill=NA) + coord_equal()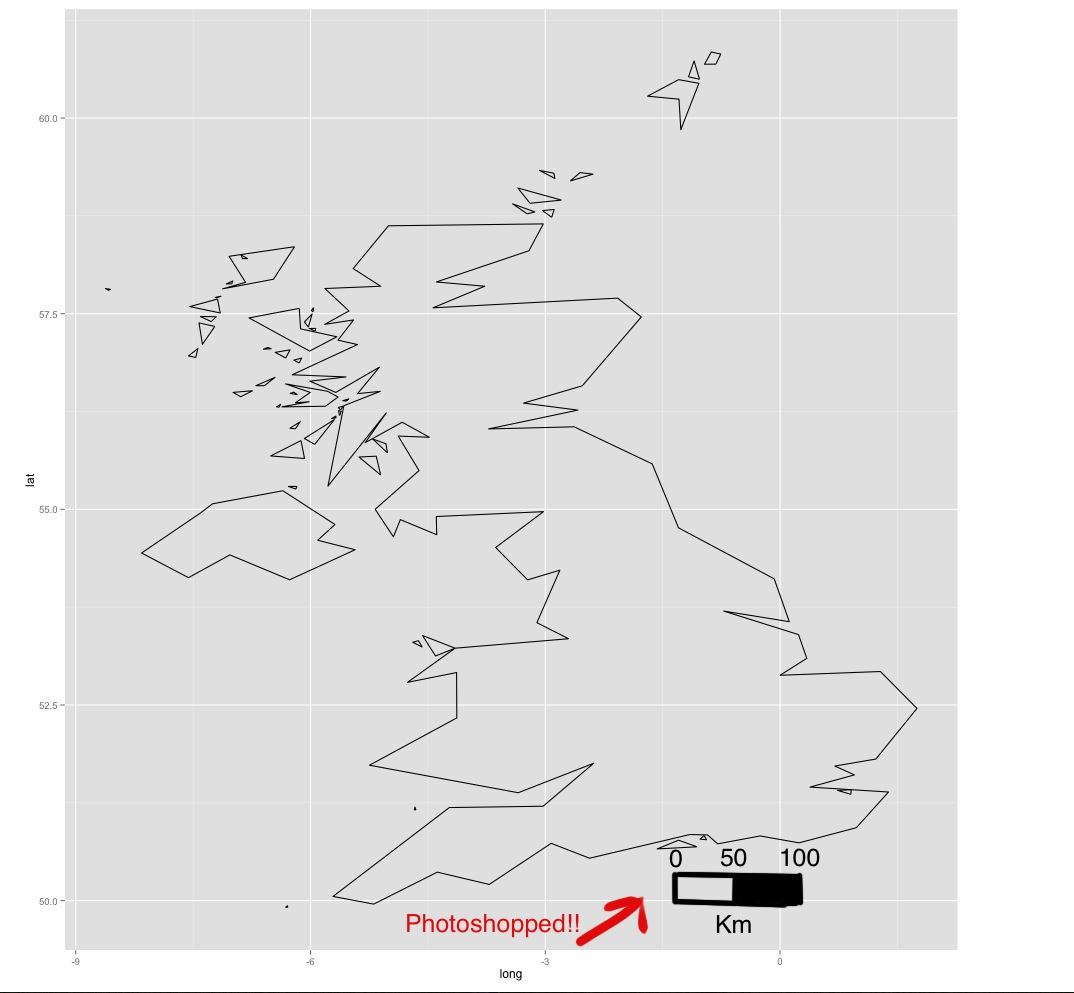
Using photoshop, I've added a scale bar to the map. How can I add a similar scale bar using
ggplot2? This post adds a scale bar, but the bar doesn't refer to distance: scale bar and north arrow on map-ggplot2-
 Beasterfield over 10 yearsHave you tested this: stackoverflow.com/questions/15486551/… ?
 -
luciano over 10 yearsYes - see link at bottom of question
-
 Andy Clifton over 10 yearsJust an observation - you want to be very careful putting scale bars on plots that cover a large range of latitude. Depending on the projection you choose, the scale bar may only be valid in one part of the image. So it's not as easy as just adding a scale bar...
 -
 Andre Silva almost 10 yearsFound this function from Osmo Salomaa and it worked for me (with UTM CRS). groups.google.com/forum/#!topic/ggplot2/klHWR0VrCYQ
-
-
 jjunju over 8 yearsThis solution doesn't seem to work with ggmap(), but seems to work with ggplot(). any clues on using this with ggmap?
 -
 gosz over 8 yearsI get an error:
Don't know how to automatically pick scale for object of type function. Defaulting to continuous Error in data.frame(x = c(13.15, 13.15, 13.2235616636229, 13.2235616636229, : arguments imply different number of rows: 5, 0What can I do?