List of plots using lapply
Solution 1
There are problems with lazy evaluation, or something like it anyway. You need to do the following:
ll<-lapply(
  seq(1,5),
  function(i) qplot(data=data.frame(y=df[, i]), df1, y)
)
This will force the y values to be updated for each plot.
More discussion in this other SO Post.
Solution 2
The problem you get is related to lazy evaluation. This means that the functions in ll are only really evaluated when you call them, which is in grid.arrange. At that time, each function will try and locate i, which will have a value of 5 by that time because that is the last value of i at the end of the lapply loop. Therefore, the data extracted from df is always the fifth column, thus your plots are all equal.
To prevent this, you need to force the data extraction to take place when the function is created, for example using @BrodieG's method. There, a new data.frame is created, forcing the data from df to be picked up. Alternatively, you can use force to force the evaluation of i.
See also for more examples and explanations of lazy evaluation:
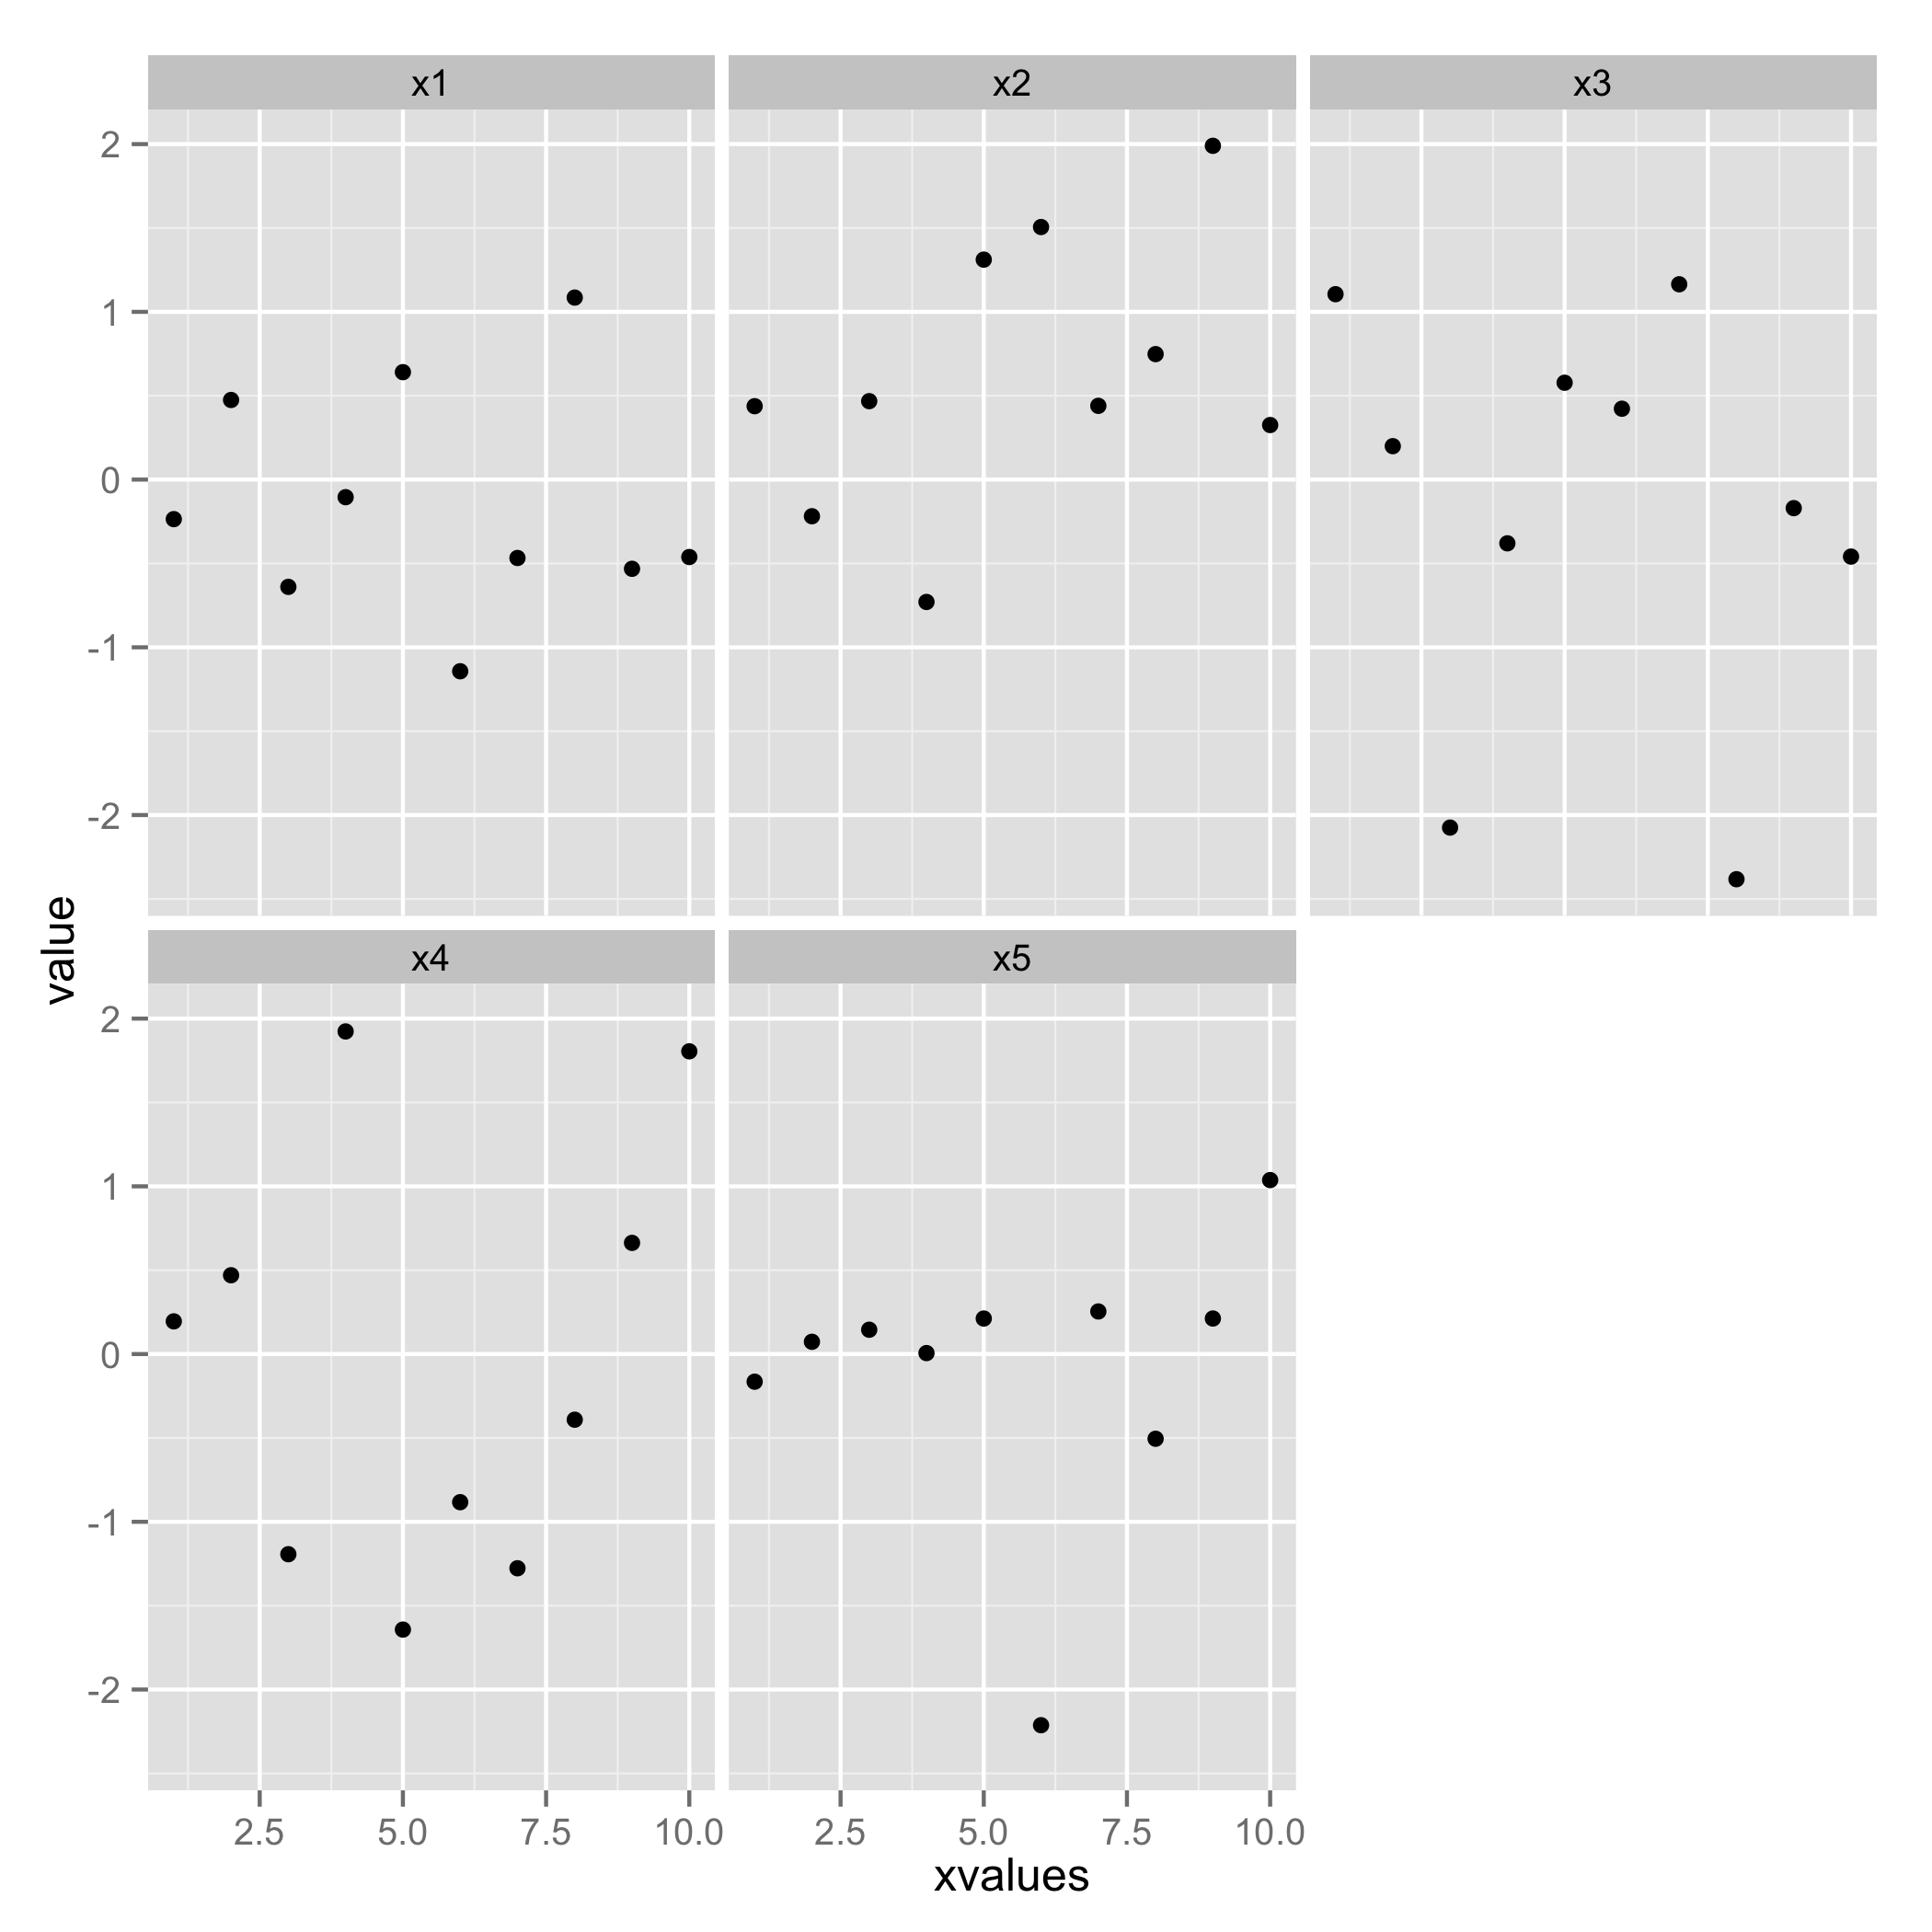
For creating plots of multiple columns in the same data.frame I would use facet_wrap. To use facet_wrap, you need to reorder your data using melt from the reshape2 package:
library(ggplot2)
library(reshape2)
df$xvalues = 1:10
df_melt = melt(df, id.vars = 'xvalues')
ggplot(df_melt, aes(x = xvalues, y = value)) +
    geom_point() + facet_wrap(~ variable)
Solution 3
You are telling it to execute for 10 columns where you only have 5. This works:
ll<-lapply(seq(1,5), function(i) qplot(df1,df[,i]))
Related videos on Youtube
 18 : 33
Pinemangoes
Updated on September 14, 2022Comments
-
 Pinemangoes 9 months
I have been using lapply and sapply as my go-to functions recently. So far so good, but why the following code does not work baffles me.
df<-as.data.frame(matrix(rnorm(50),ncol=5))
names(df)<-c("x1","x2","x3","x4","x5")
df1<-seq_len(10)
ll<-lapply(seq(1,5), function(i) qplot(df1,df[,i]))
I get the error:
Error in `[.data.frame`(df, , i) : undefined columns selectedOk, apparently I made quite an unfortunate mistake in my reproducible code. It works now, but all the plots in the
lllist are the same plot. When I run this:do.call(grid.arrange,ll)I get the following image:
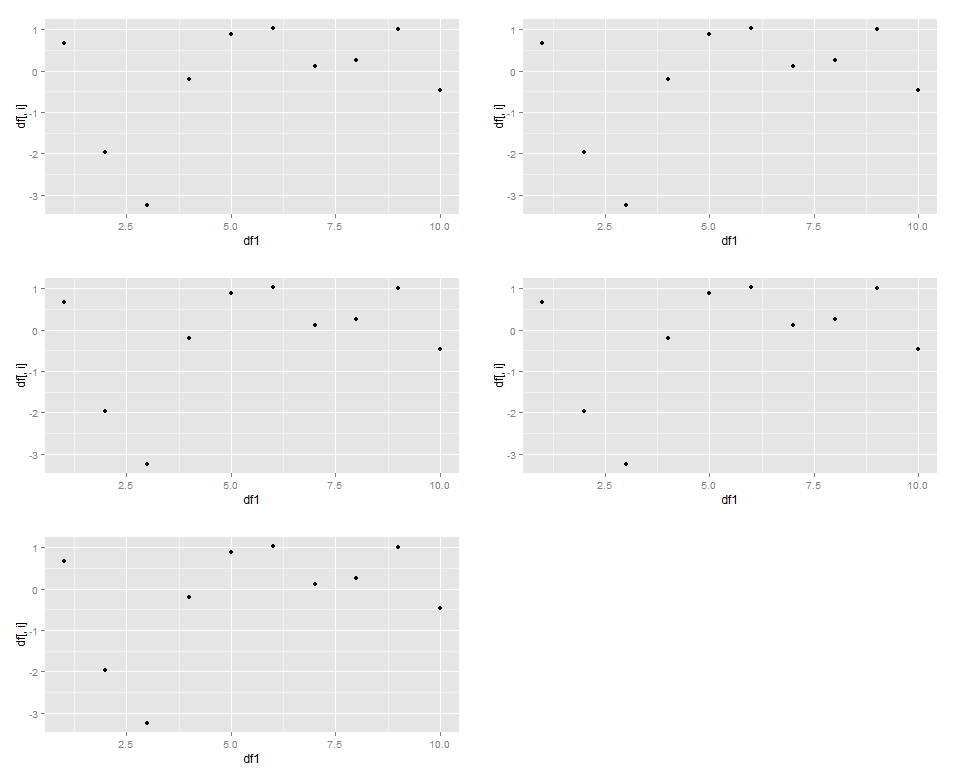
All the plots are the same! This is also the output I get when I run this through my data.
-
 Paul Hiemstra about 9 yearsGiven the example plot you posted, I would not use
grid.arrange, but switch to using facetting (facet_wraporfacet_grid). See my answer for an example. Facetting is much easier and flexible in my opinion.
-
-
Pinemangoes about 9 yearsThanks. I have edited my initial post as I'm now seeing the same issue as in my dataset.
-
Pinemangoes about 9 yearsThis is indeed a better solution since it allows me to use the more elegant
ggplot+ggsavecombo rather than theqplot+grid.arrangemess. Thank you for your help. -
Paul Hiemstra about 9 yearsI've rarely had to resort to using a loop, facetting can almost always be used to get the same result.